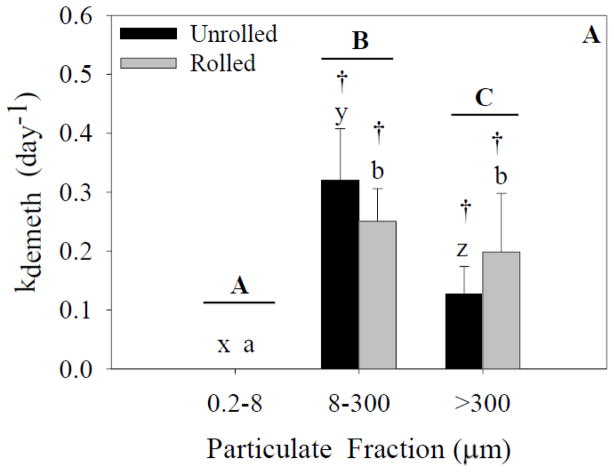
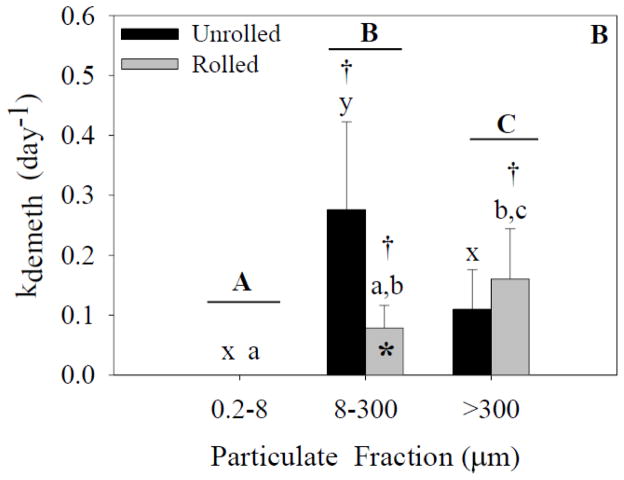
Figure 5.
Demethylation rates for each size fraction and treatment. Capital letters specify significant differences between particle-size fractions (ANOVA model), whereas lower-case letters specify significant differences between particle-size fractions within a treatment (Tukey’s post-hoc test; x-z for unrolled treatment, a-c for rolled treatment). Asterisks specify significant differences between treatments within a particle-size fraction (Tukey’s post-hoc test). Crosses specify that means are significantly different than zero (single sample t-test). In experiment 1(A), a significant effect of particle size fraction was found (p<0.05). In experiment 2 (B), significant effects of both particle size fraction and treatment were found (p<0.05). Data represent means ± standard deviation (n=6).


