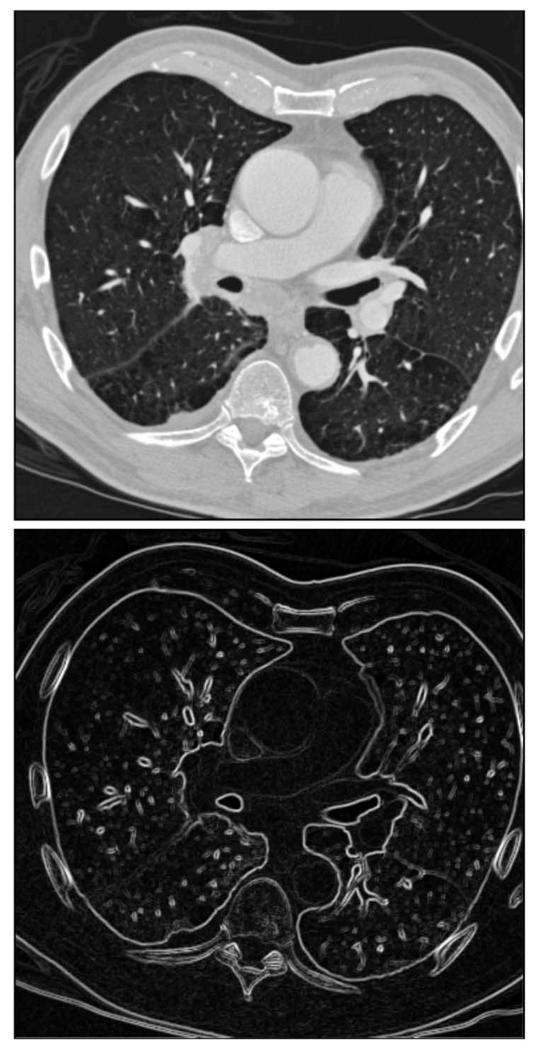
Fig. 2.
(Top) a transaxial CT slice image through the lungs of a patient; the gray scale window is [−1200 HU, 600 HU]. (Bottom) the GMI corresponding to the same image [0 HU, 800 HU]. The gray scale units are in the Hounsfield (HU) scale, where −1000 HU and 0 HU correspond to air and water, respectively. Despite the complex structure in the CT slice image, the GMI is clearly more sparse than the original image. Note again the sharpness of the heart. In this image the vessels through heart are clearly visible due to the use of CT contrast agent. The image, courtesy of Alexandra Cunliffe, Ph.D., is one of many from the study in Ref. [53].

