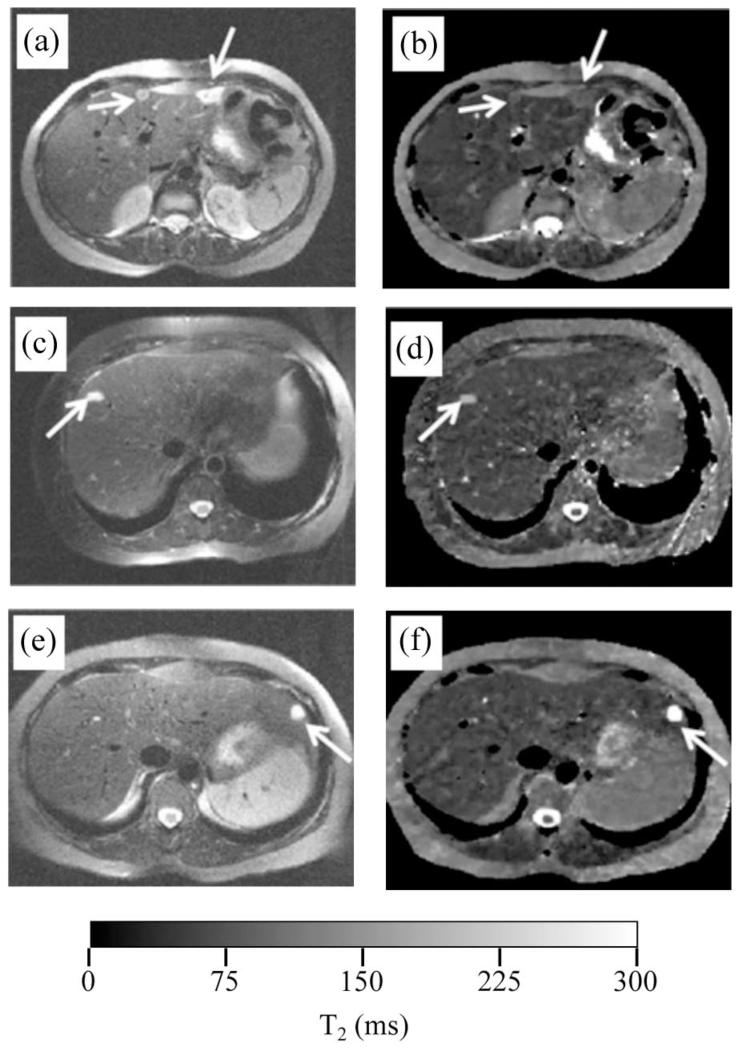
Fig. 7.
Anatomical images (left column) and T2 maps (right column) obtained for patients with diagnosed metastases (a,b), a hemangioma (c,d) and a cyst (e,f) as indicated by the arrows. Average T2 values were 88 ms and 89 ms for the metastatic lesions, 170 ms for the hemangioma and 599 ms for the cyst.

