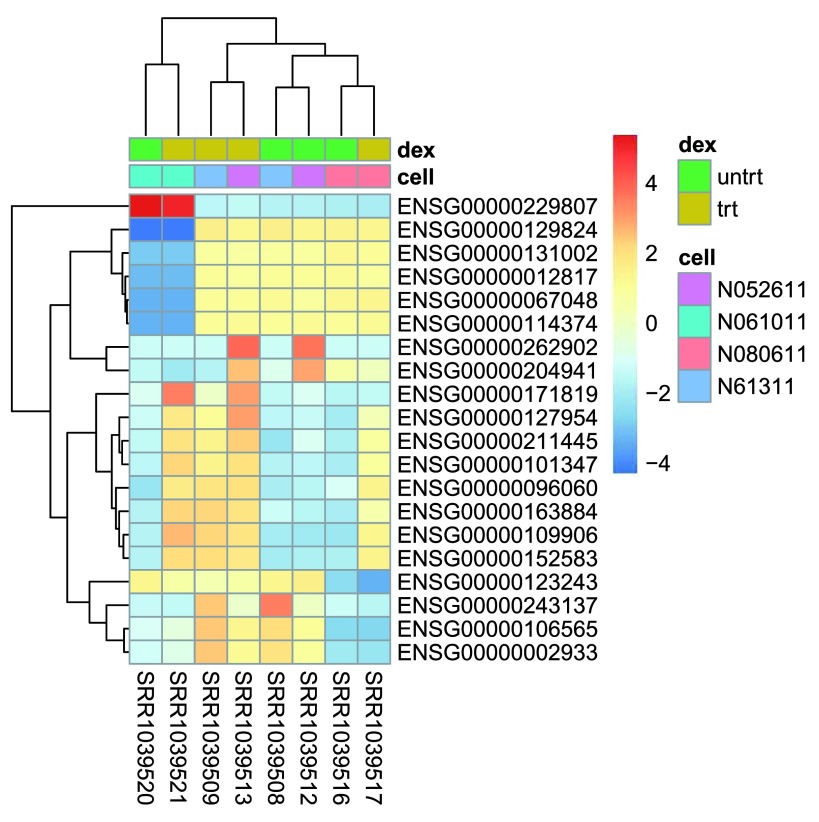
Figure 13. Heatmap of relative rlog-transformed values across samples.
Treatment status and cell line information are shown with colored bars at the top of the heatmap. Note that a set of genes at the top of the heatmap are separating the N061011 cell line from the others. In the center of the heatmap, we see a set of genes for which the dexamethasone treated samples have higher gene expression.

