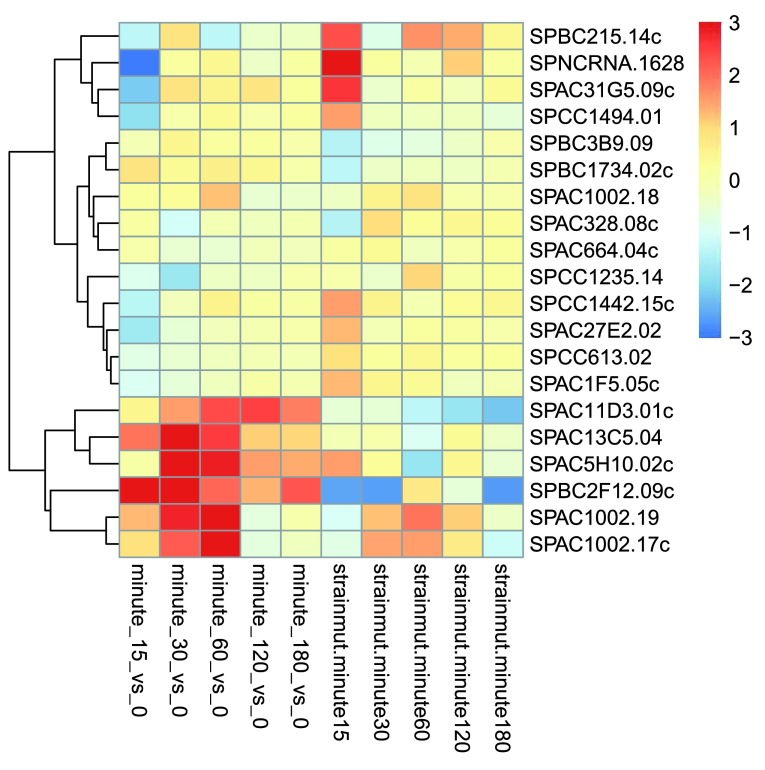
Figure 18. Heatmap of log2 fold changes for genes with smallest adjusted p value.
The bottom set of genes show strong induction of expression for the baseline samples in minutes 15–60 (red boxes in the bottom left corner), but then have slight differences for the mutant strain (shown in the boxes in the bottom right corner).

