
Figure 3.
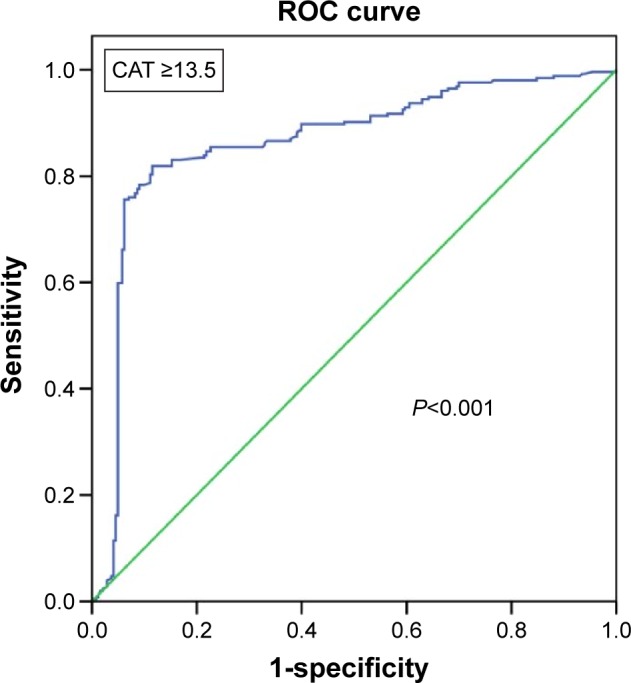
ROC analysis derived from the Cox regression model in its capacity to predict combined event. This model includes the number of exacerbations in the previous year and CAT ≥13.5 points (AUC =0.864, P<0.001).
Abbreviations: ROC, receiver operating characteristic; CAT, COPD Assessment Test; AUC, area under the curve.