Figure 5.

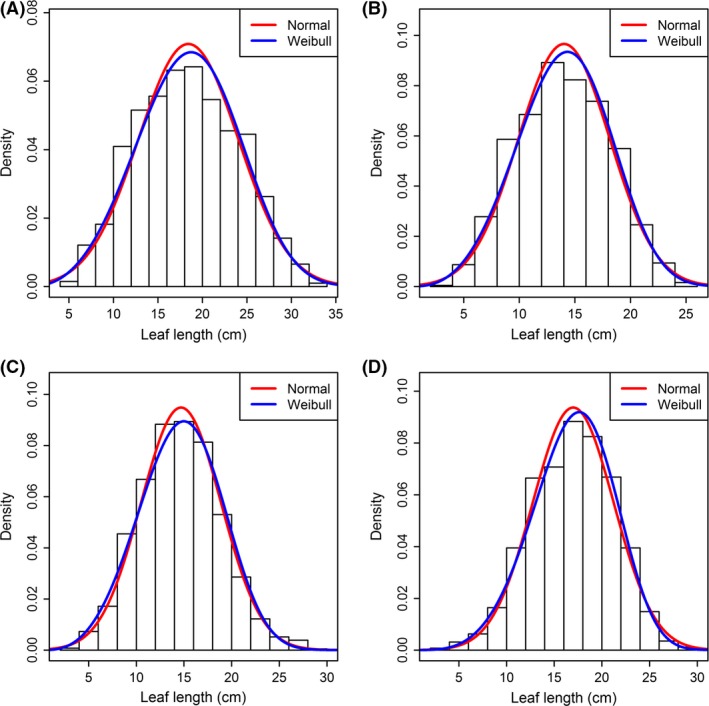
Comparison between the normal distribution and the Weibull distribution in describing the leaf length. Panels (A–D) represent species 1–4, respectively.

Comparison between the normal distribution and the Weibull distribution in describing the leaf length. Panels (A–D) represent species 1–4, respectively.