
Figure 2.
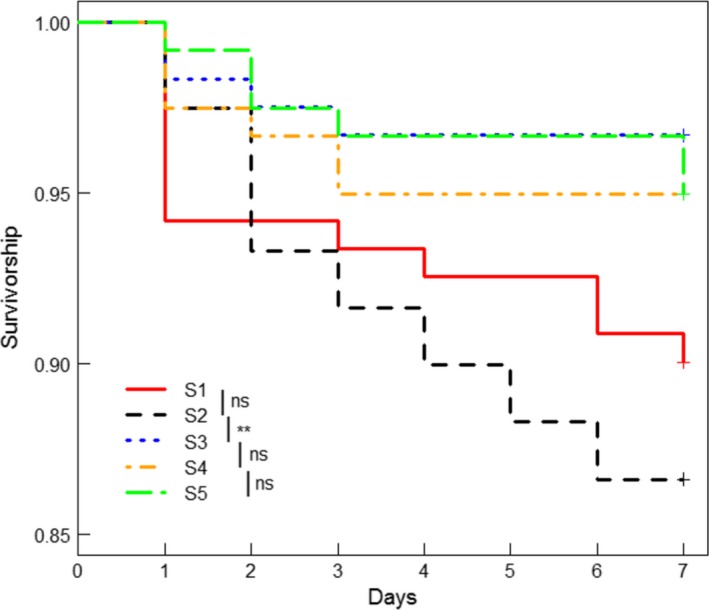
Cumulative survivorship curves for five categories of body size of artificial models over 7 days. See Table 1 for details of size categories. Smaller artificial models (S2) survived significantly less compared with larger models. Vertical bars in the legend represent the planned comparisons conducted between pairs of artificial model categories; ns: not significant.