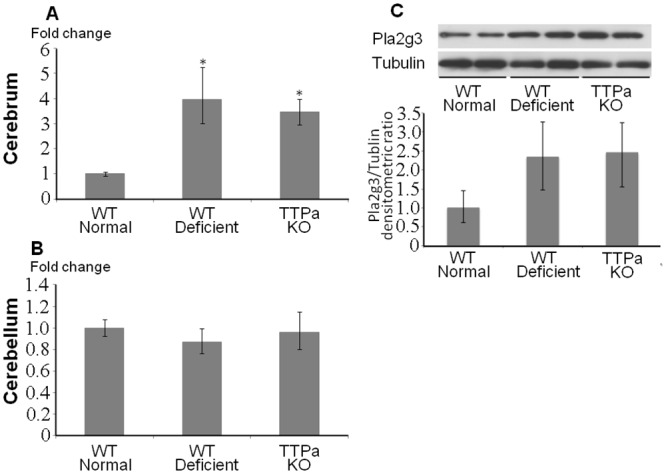
Fig 2. Induction of Pla2g3 expression in cerebrum by oxidative stress.

A, B, Quantitative RT-PCR results of Pla2g3 in cerebrum and cerebellum are shown. Fold changes to the aged wild-type mice on normal diet are indicated. n = 4 in each group. C, Western blots for Pla2g3 and alpha-tubulin are shown. Abbreviation used; WT normal; wild type 29 months old mice fed on normal diet, WT deficient; 29 months old wild type mice fed on vitamin E deficient diet, ttpKO deficient; 29 months old Ttpa -/- mice fed on vitamin E deficient diet. *p<0.05.
