
Figure 2.
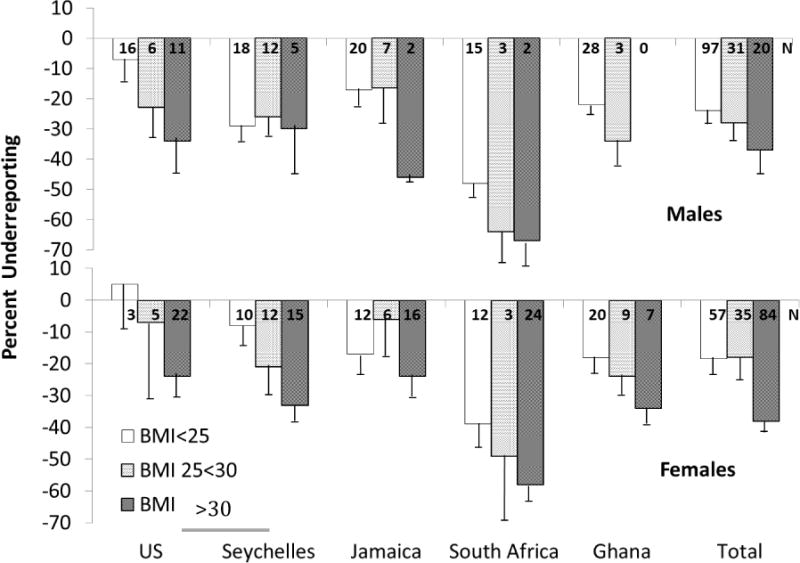
Percent of energy intake underreporting relative to energy expenditure as a function of body mass index (BMI). Panel A displays the results for men and panel B displays the results for women. Error bars indicate the standard error of the mean (SEM); the number at the top of each bar represents the number of participant in each BMI grouping by site.