
Figure 3.
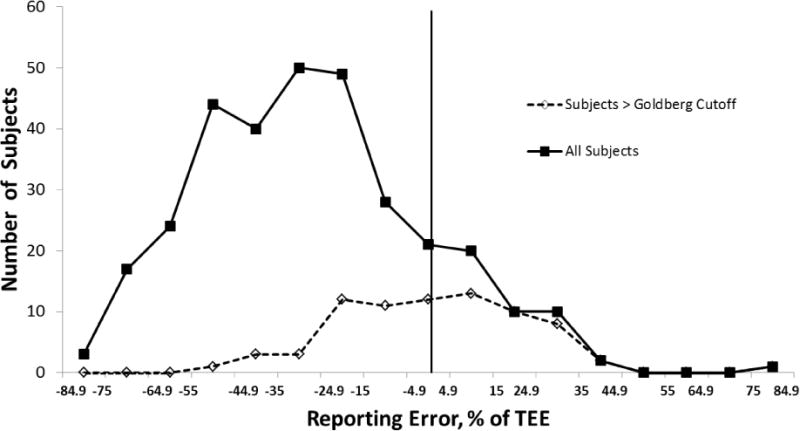
Distribution of energy intake reporting error relative to measured total energy expenditure for the entire cohort (solid line) and those that pass the Goldberg cutoff of 1.35 × predicted resting energy expenditure (dotted line). The vertical line represents 0% error.