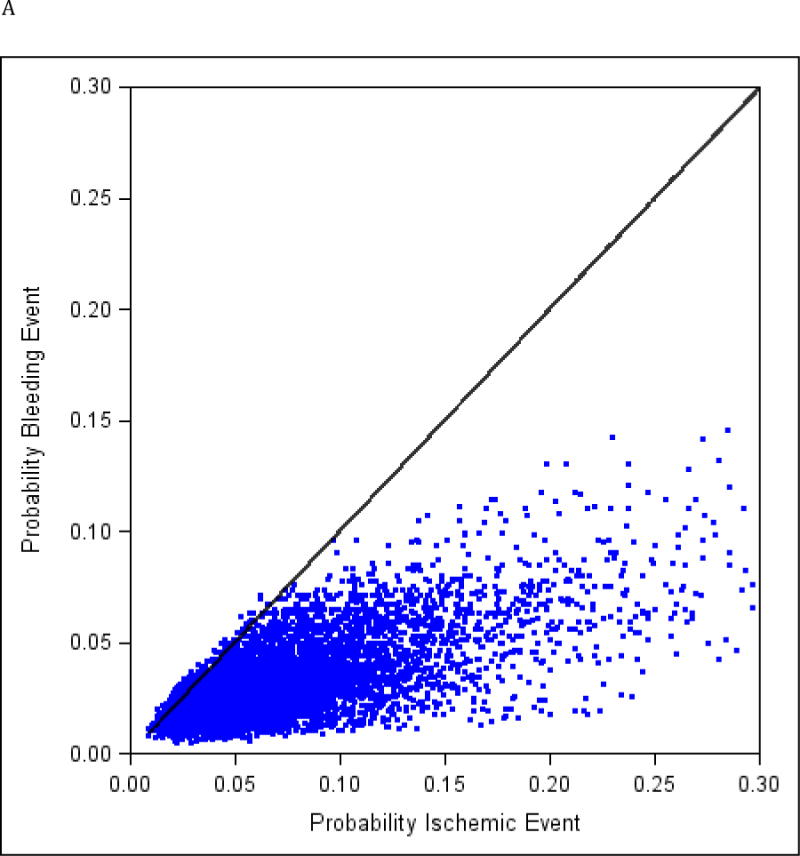
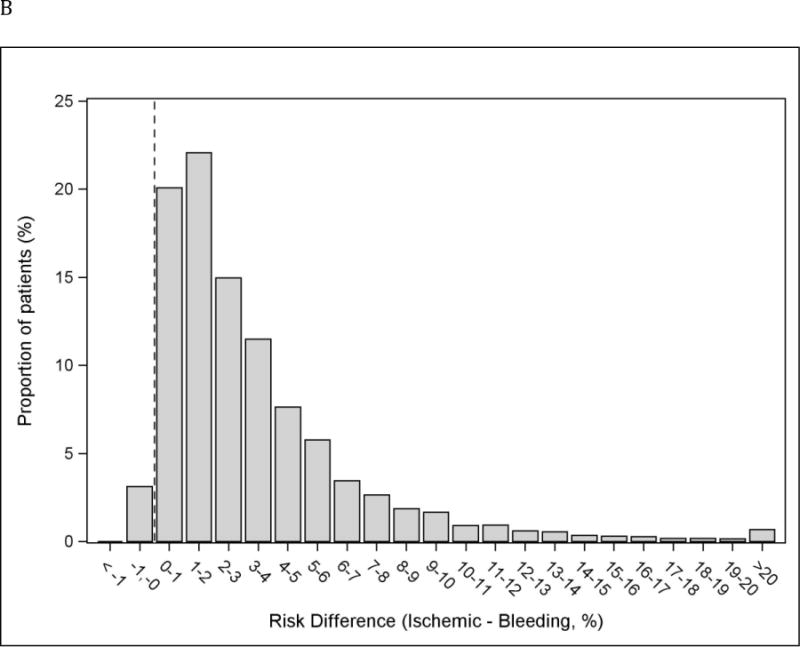
Figure 2.


Individual predicted probabilities of long-term ischemic and bleeding events. Black line represents identical ischemic and bleeding risk within an individual subject. ρ=0.76; p < 0.001 (A). Distribution of the absolute difference in risk of ischemic and bleeding endpoints. Dotted vertical line represents identical ischemic and bleeding risk within an individual subject. Bars on the right side of the line correspond to subjects with greater ischemic risk than bleeding risk. 3.1% of subjects had ischemic risk exceeding bleeding risk. (B).
*Negative risk difference represents a higher bleeding risk than ischemic risk.
