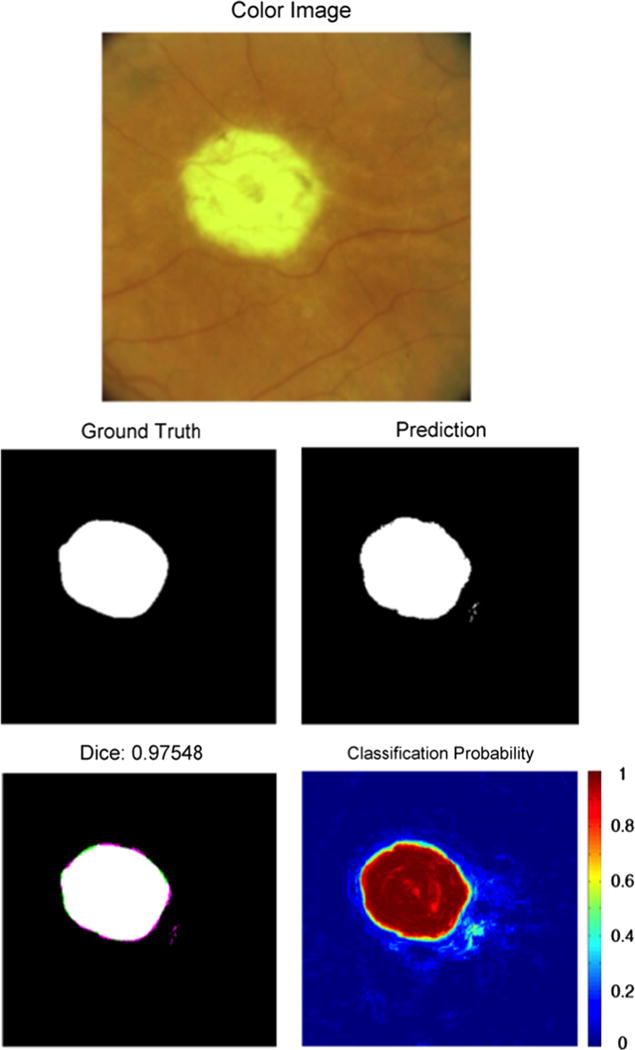
Fig. 4.

An example of segmentation results of an unambiguous presentation of GA. Note the high classification accuracy in this unambiguous image. The top image is the color fundus image of the eye with GA. The “Ground Truth” image indicates the expert-assigned segmentation, with white pixels corresponding to GA and black pixels corresponding to an absence of GA. The “Prediction” image is the GA prediction from our segmentation algorithm. The “Dice” image provides the Dice coefficient, as well as a comparison image between the ground truth and the segmentation. Pixels that are either white or black were classified the same by both the human expert and the segmentation algorithm. Pink pixels were incorrectly identified as GA by the segmentation algorithm. Green pixels were classified as GA in the ground truth but missed by the segmentation algorithm. The “Classification Probability” image shows the probability that the algorithm would classify a pixel as GA, with red corresponding to probability 1 and blue corresponding to probability 0. 0.5 was used as the classification threshold. (For interpretation of the references to color in this figure caption, the reader is referred to the web version of this paper.)
