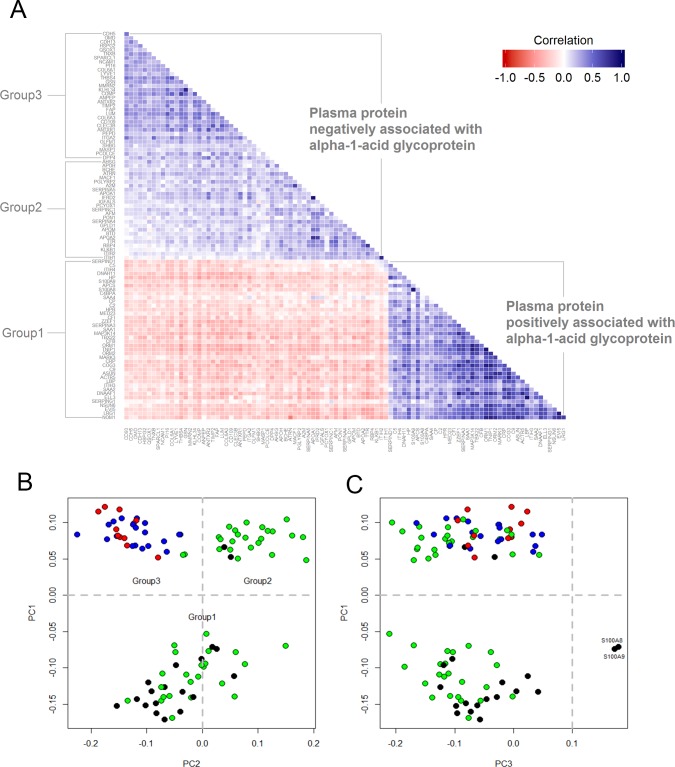
Fig 2. Correlation matrix and bi-plots from principal components (PC) analysis using plasma proteins associated with α-1-acid glycoprotein in 6–8 year old children in rural Nepal.
(A) Bottom-triangle is the correlation matrix of plasma proteins positively associated with AGP (Group1). Upper-triangle is the correlation matrix of plasma protein negatively associated with AGP (Group 2 & 3). (B and C) Bi-plot was constructed by the first three principle components. Color depicts representative tissue origins or subcellular localization of proteins: black-intracellular space; green-hepatic origin and secreted into plasma; red-extracellular matrix; blue-extracellular matrix membrane binding. Proteins with PC1 less than 0 were assigned into group 1, proteins with PC1 and PC2 greater than 0 were assigned into group 2, and proteins with PC1 greater than 0 and PC2 less than 0 were assigned into group 3 (4 proteins were not included due to missing values and lack of information about subcellular localization).

