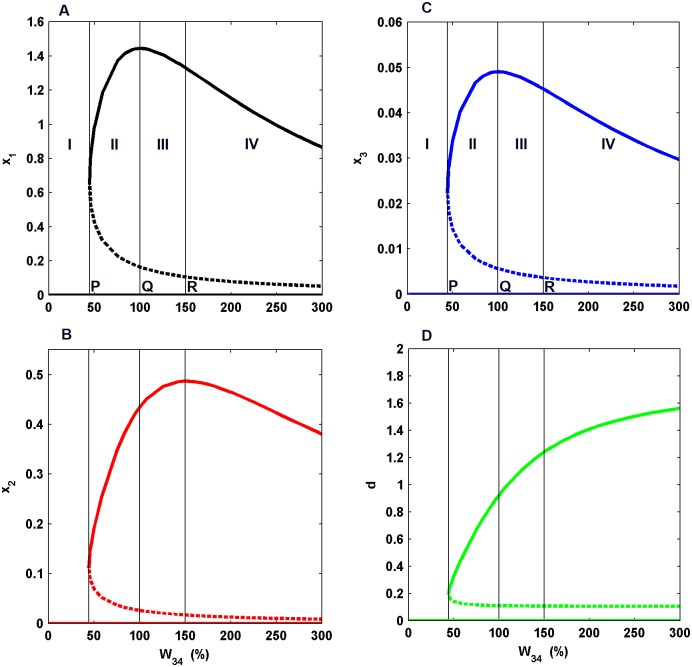
Fig 3. Bifurcation Diagrams.
These curves depict the equilibrium activity of the pyramidal neurons (A), inhibitory neurons (B), dopaminergic neurons (C) and D1 receptor activation (D) versus the bifurcation parameter W 34. The solid (dotted) lines portray stable (unstable) states of the system. The curves are partitioned into four regions I, II, III and IV. Point P, Q and R are the boundary points of these regions. Point P is the point at which bistability appears in the system. Point Q is the point of maximum equilibrium activity of excitatory neurons and Point R is the point of maximum equilibrium activity of interneurons.

