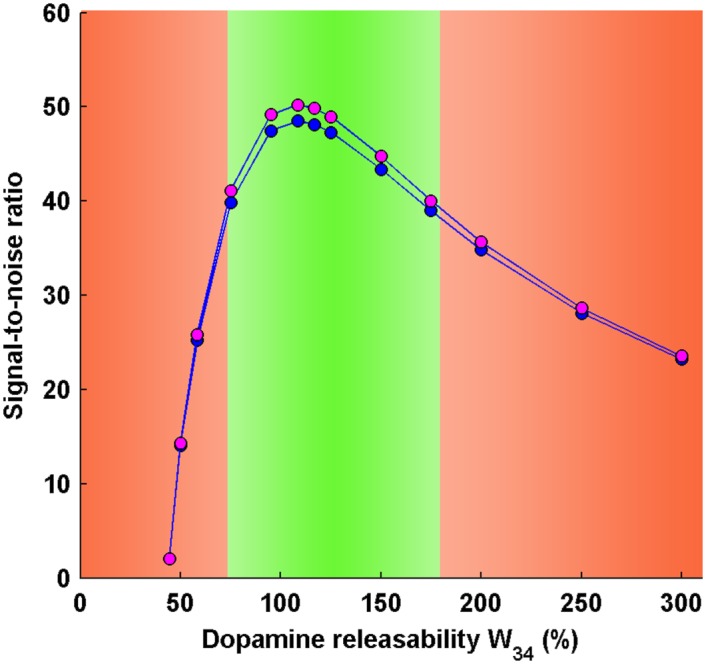
Fig 7. Signal-to-noise ratio (SNR) in pyramidal and midbrain activities in the working memory state during delay interval.

The SNR profiles of pyramidal and midbrain activities exhibit an inverted-U shaped profile similar to the signal profile seen in the bifurcation diagram. The SNR profiles are consistent with the error bar plots of pyramidal and midbrain activities, respectively, during delay interval. The optimal region (green zone) is associated with maximum signal-to-noise ratio and signifies establishment of efficient working memory during delay interval. At abnormal levels of dopamine releasability W 34 (right and left, red zone), there occurs a significant decline in the signal-to-noise ratio which may lead to working memory impairment.
