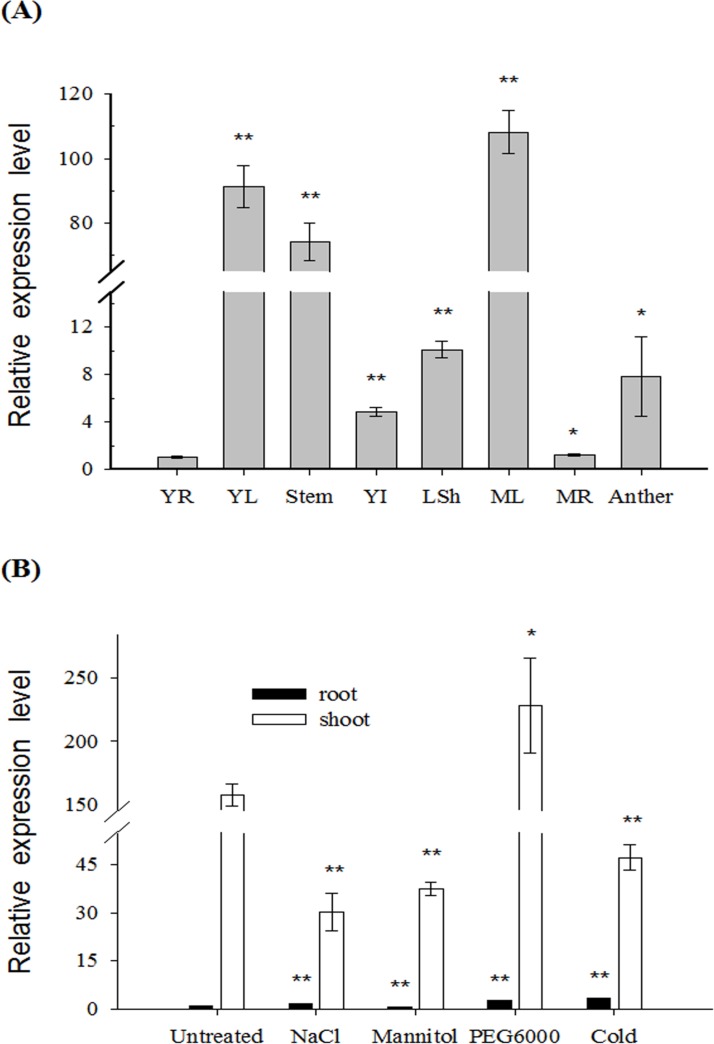
Fig 2. Expression analysis of HbFd1 in H. brevisubulatum by real-time PCR.
(A) Expression pattern of HbFd1 from different tissues of H. brevisubulatum. YR, young root; YL, young leaf; steam; YI, young inflorescence; LSh, leaf sheath; ML, mature leaf; MR, mature root and anther. (B) Expression pattern of HbFd1 in H. brevisubulatum under 350 mM NaCl, 350 mM mannitol and 10% PEG6000 stressed for 6 hrs, and 4°C for 12 hrs, respectively. All assays were performed in triplicate. Significant differences were determined relative to each control using a student’s t-test [P-values < 0.05 (*) and < 0.01 (**)]. Bars: SD.

