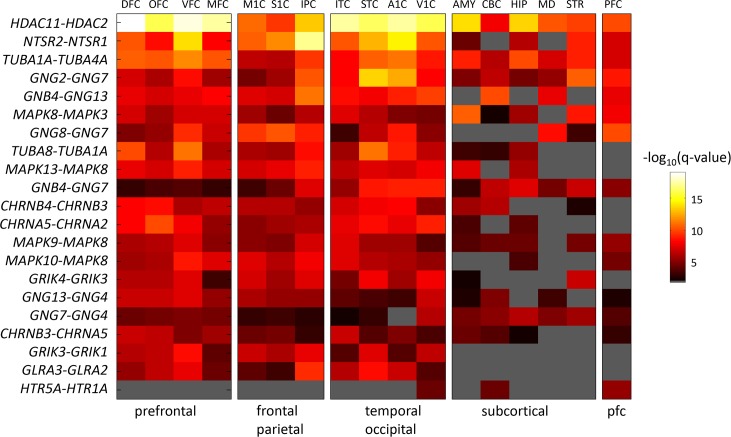
Fig 2. Dissimilarity significance of the top 20 genes in 17 brain regions measured by Kang et al. [32] and in the prefrontal cortex measured by Colantouni et al. [33].
Colors correspond to negative log 10(p-values) of Pearson correlation. Gray pixels denote regions in which the range of expression levels (maximum-minimum) was below 1.5 for at least one gene, or an insignificant q-value. The bottom row shows dissimilarity for an interesting pair of serotonin receptors. Brain regions are grouped and sorted as follows: prefrontal: DFC, OFC, VFC, MFC; frontal-parietal: M1C, S1C, IPC; temporal-occipital: ITC, STC, A1C, V1C; subcortical: AMY, CBC, HIP, MD, STR; prefrontal data from [33]: PFC. Region codes are listed in the Methods section. The genes coding for histone deacetylase, HDAC2 and HDAC11 exhibit significant dissimilarity levels in all brain areas. The genes coding for Neurotensin receptor NTSR1 and NTSR2 exhibit significant dissimilarity mainly in cortical regions and the striatum.

