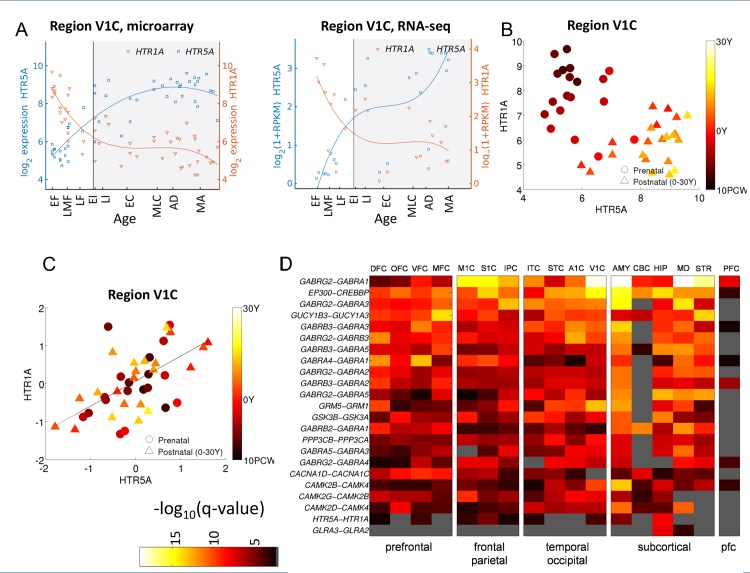
Fig 3. Age-corrected correlation.
(A) An example of fitting a cubic spline[80] to the expression of HTR1A and HTR5A in the primary visual cortex (V1C). Circles denote measured data points and solid lines denote a cubic spline fit. (B) Expression levels of HTR1A and HTR5A. Circles denote the expression of prenatal subjects, triangles of postnatal. The color scale denotes the age of each donor, with older subjects in light yellow and young subjects in dark. The expression is anti-correlated (ρ = -0.58). (C) After removing the population effect of age, the expression of HTR1A and HTR5A is positively correlated across subjects (ρ = 0.53, q-value < 10−4, Pearson). (D) The magnitude of age-corrected correlation (residuals) of 20 CDV pairs, ranked by the mean correlation over regions.

