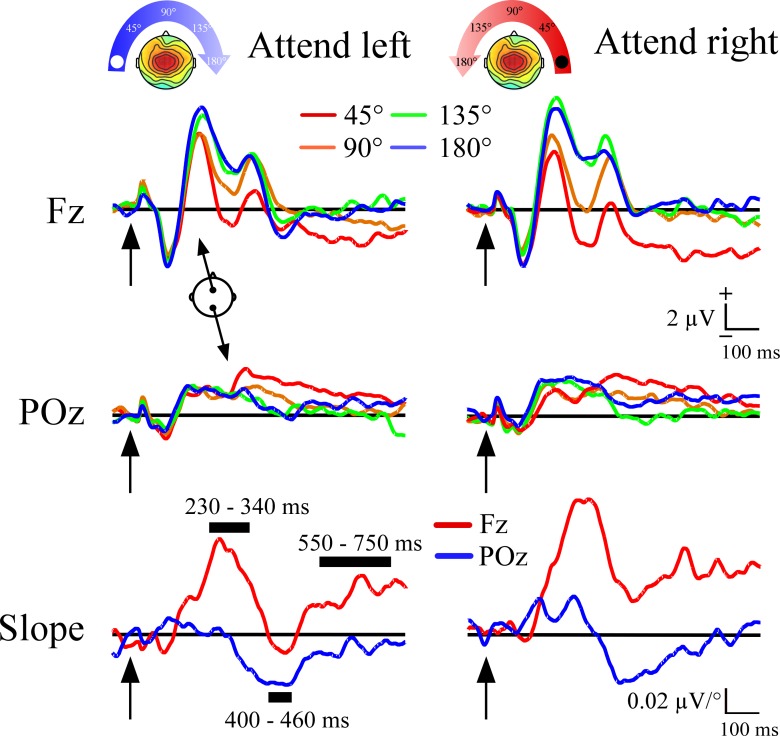
Fig 2. Event-related potentials to non-target distractors as a function of angular distance from target location.
The top and middle rows illustrate the basic gradient effects in the ERPs. The black rectangles indicate the three time windows where voltage was measured. Within the two windows at Fz there were progressively more positive potentials as a function of distance from the target shown. At the POz site the opposite pattern was seen, non-target potentials became more negative with greater distance from the target. The selection of time windows was based on plots of the slope calculated across all four non-target locations at each 2 ms time point, and are shown in the bottom row.

