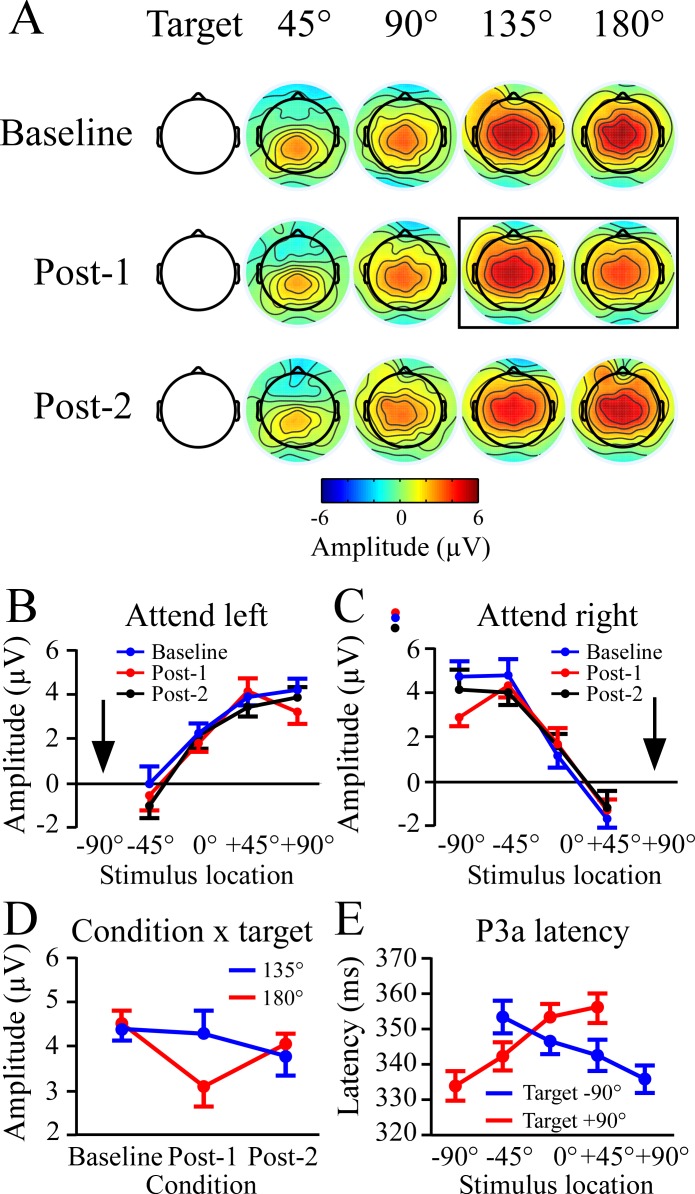
Fig 3. Non-target distractor potentials between 230–340 ms at the Fz site.
This time window reflects the first peak of the non-target slope function shown in Fig 2, and corresponds to the P3a component in previous studies. A) Topographic plots of the 230–340 ms window across non-target locations in each of the three conditions. Results were collapsed across left and right target blocks because there was no difference between target locations. Box outline highlights the reduction in voltage between the 135° and 180° locations in the Post-1 condition. B, C) Voltage plots for non-target locations when attending to the left (B) and right (C). For both attended locations there were strong linear increases in voltage with greater non-target distance from the target. For B and C the arrow indicates the location of the attended target. D) Plot showing the significant reduction in 230–340 ms amplitude at the most distant non-target following rTMS. In the Post-2 condition the amplitude had recovered to baseline levels. E) P3a latency as a function of non-target location. Latencies were longest to non-targets near the target, and progressively decreased with more distance from the target location.

