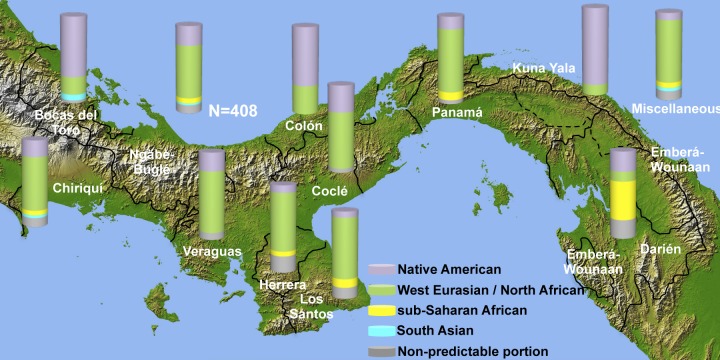
Fig 1. Spatial distributions of Y-chromosome components in Panama.
Bars show Native American (violet), West Eurasian/North African (green), sub-Saharan African (yellow) and South Asian (light blue) components in each province or comarca. In grey the Y-chromosome portion with discordant haplogroup predictions. The physical map of Panama is from NASA Earth Observatory (http://earthobservatory.nasa.gov/).

