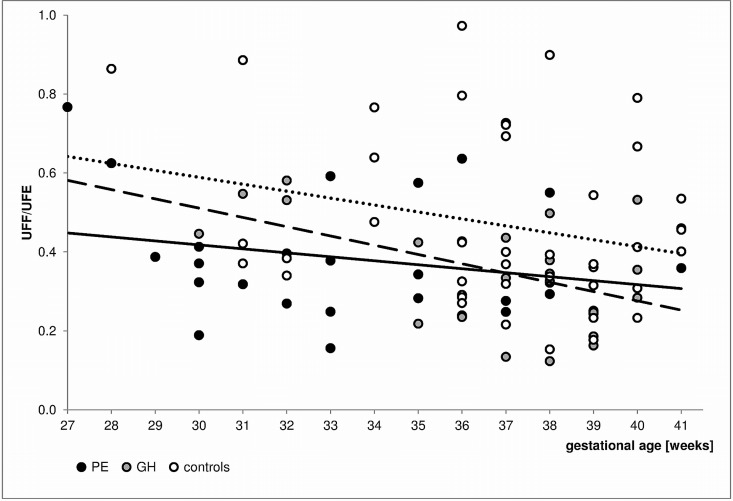
Fig 2. Changes in UFF/UFE values by gestational age in the PE, GH and normotensive subjects.
The trend lines are marked as follows: the solid line reflects data for the PE subjects, the dashed line represents data for the GH subjects, and the dotted line represents data for the normotensive patients. The applied multiple regression models indicated that the UFF/UFE was significantly influenced by the PE (p = 0.018, R = -0.290) and nearly significantly by the GA (p = 0.052, R = -0.237). Moreover, the UFF/UFE was significantly dependent on both the GH and GA (p = 0.014, R = -0.287 and p = 0.013, R = -0.290, respectively).

