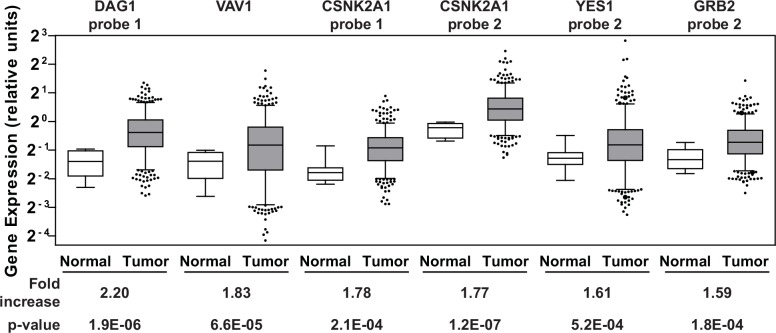
Fig 3. Gene expression in clinical samples.
Agilent gene expression data from TCGA on 518 serous cystadenocarcinomas and 8 fallopian tube samples derived from healthy individuals were queried for 29 dasatinib sensitizing genes. The six Agilent probes that showed ≥ 1.5-fold increase in the average gene expression of the respective genes in the tumor samples (gray boxes) relative to the controls (white boxes) are shown. The whiskers of each box plot represent the expression values at the 5th and the 95th percentiles. The p-values were calculated using an unpaired two-tailed t-test using GraphPad Prism. S4 Table lists the average expression values of the Agilent probes across the tumor and normal samples for all 29 genes.

