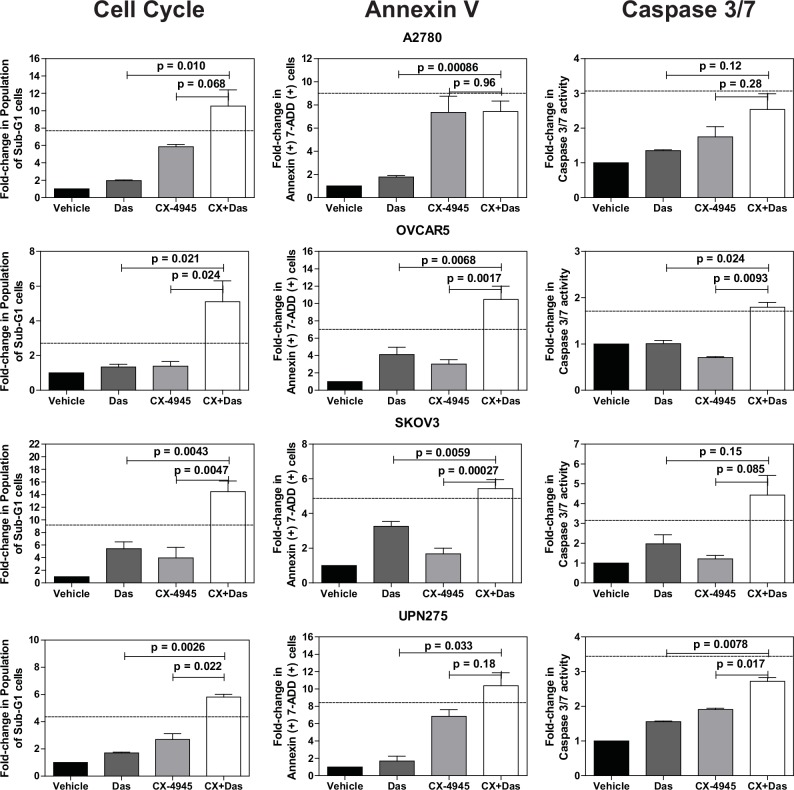
Fig 5. Quantification of cell cycle and apoptosis assays.
Cell cycle and apoptosis data were quantified for the indicated fold-changes relative to vehicle treated cells and are presented as bar graphs showing the average fold-change ± standard error of mean. In all three assays, single (das, 0.5 μM; CX-4945, 10 μM) and combination drug treatments (das, 0.5 μM; CX4945, 10 μM) were for 72 h. P-values were calculated using a t-test comparing the combination treatment group to each single agent treatment group. The dashed line indicates the theoretical value if the drugs act additively calculated using the Bliss independence model (Bliss additivity value = FCDas + (FCCX-4945 * (100—FCDas))/100 where FC is fold-change [51]. Observed values larger than the Bliss additivity value indicate synergy. See Materials and Methods for additional assay details.

