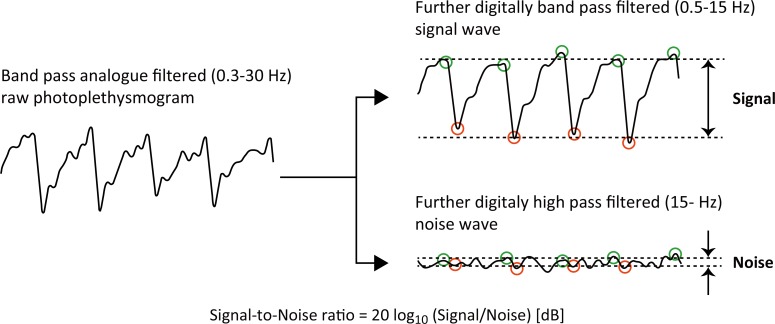
Fig 3. Calculation of the signal-to-noise ratio.
This shows how the PPGs are analysed to calculate the signal-to-noise ratios of the two photoplethysmography systems. Note that the original raw analogue filtered signal (0.3−30 Hz) is further digitally filtered (0.5−15 Hz) to produce the ‘Signal’ component. Also, the same raw signal is further digitally high pass filtered (15−30 Hz) to produce the ‘Noise’ component.

