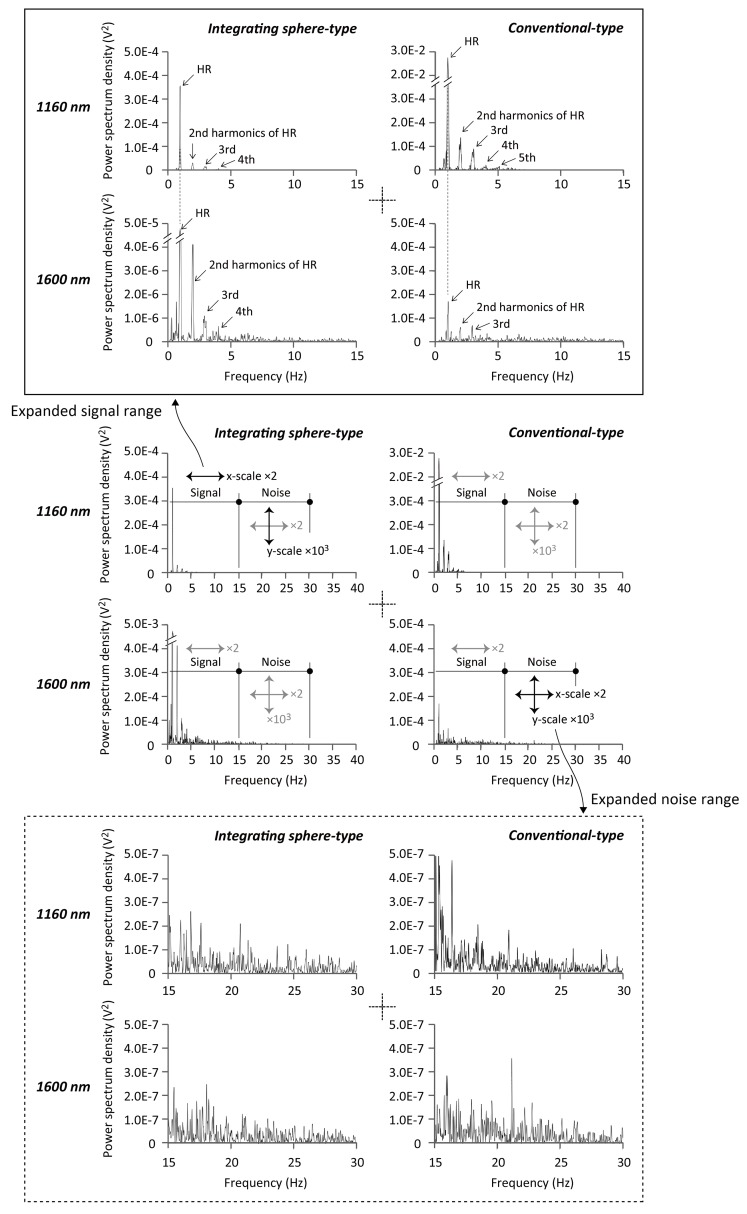
Fig 6. Sample spectra of finger-photoplethysmogram.
Typical example of power spectra derived from the photoplethysmograms obtained from the conventional transmission-type instrument (right two spectra) and the integrating sphere-type instrument (left) with wavelengths of 1160 nm (upper) and 1600 nm (lower).

