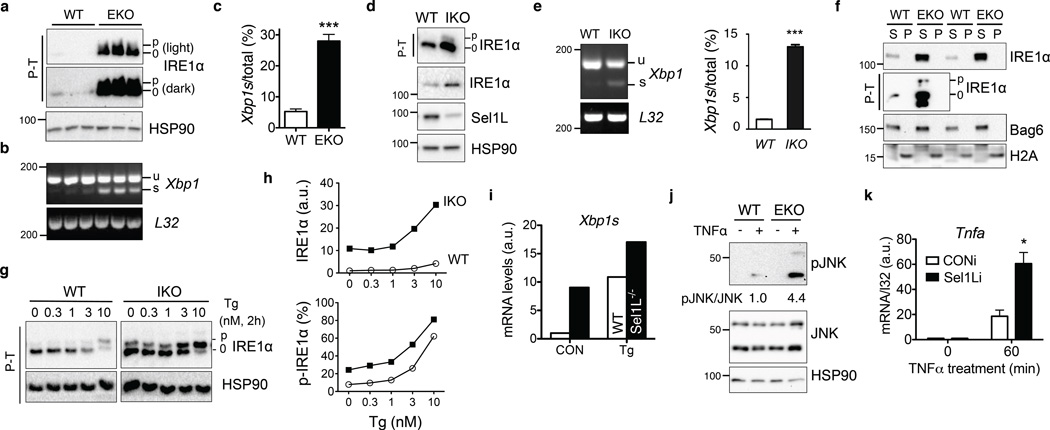
Figure 6. Consequences of Sel1L-Hrd1 ERAD deficiency on IRE1α activation and inflammation.
(a) Phos-tag-based (P-T) Western blot analysis of IRE1α phosphorylation in isolated colonic epithelium of WT and Sel1LΔIEC (EKO) mice. N=3 mice of each genotype. (b–c) RT-PCR analysis of Xbp1 mRNA splicing, with quantitation shown in (c). Error bars represent sem, n=3 mice of each genotype. (d–e) Western blot and RT-PCR analyses of IRE1α activation in WT and IKO MEFs, with quantitation of spliced Xbp1 shown in (e). Error bars represent sem, n=3 independent experiments. (f) Western blot analysis of IRE1α in the NP-40 soluble (S) and insoluble (P) fractions of the colon using lysis buffer containing 0.5% NP-40. The distribution of Bag6 and H2A marks the soluble and insoluble pellet fractions, respectively. (g–h) Western blot analysis of IRE1α activation in WT and IKO MEFs treated with thapsigargin (Tg) at the indicated concentration for 2 h, with quantitation of total p-IRE1α and percent of p-IRE1α shown in (h). In (g), data was derived from the same blot at the same exposure, with irrelevant lanes in the middle cut off. (i) Q-PCR analysis of mRNA levels of Xbp1s in WT and Sel1L-deficient primary adipocytes that were either mock (CON) or treated with 150 nM Tg for 3 h. n=2 mice per genotype. (j–k) Sel1L deficiency enhances inflammatory tone of enterocytes. (j) Primary crypt organoids were treated with 50 ng/ml TNFα for 20 min and analyzed for JNK phosphorylation. Quantitation of the average of n=2 mice of each genotype shown below the blot. (k) m-ICcl2enterocytes stably expressing either control (CONi) or Sel1L knockdown (Sel1Li) were treated with 50 ng/mL murine TNFα for 60 min and analyzed for Tnfa gene expression. Error bars represent sem, n=3 independent experiments. (a–e) and (k) are representative of 3 independent experiments, while others are representative of 2 independent experiments. *, p<0.05; ***, p<0.001 by Student’s two-tailed t test. Unprocessed original scans of blots are shown in Supplementary Fig. 9.

