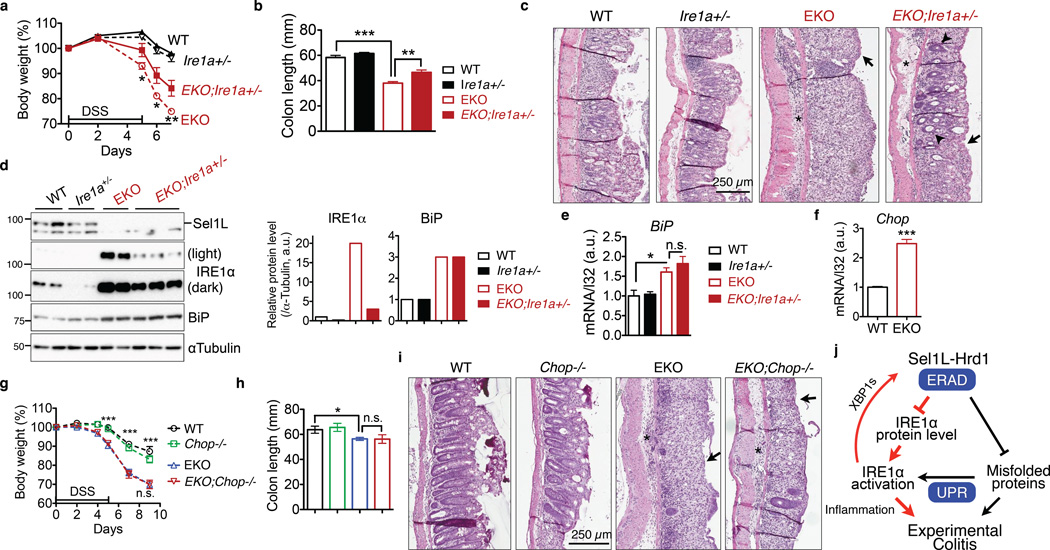
Figure 8. IRE1α protein accumulation is critical for the pathogenesis of colitis in Sel1LΔIEC (EKO) mice.
(a–c) 7-week-old littermates were treated with 3% DSS for 5 days followed by fresh water: (a) body weight change. *, p<0.05; **, p<0.01 comparing EKO to EKO;Ire1a+/− by Student’s t test. (b) Colon length on day 7. (a-b), error bars represent sem from n=6 mice of each genotype pooled from three independent experiments. (c) Representative H&E images of colon on day 7 showing epithelial ulceration (arrows), severe edema (asterisks), and regenerative crypts (arrow heads). Representative images of 6 mice studied. (d) Western blot analysis of IRE1α and Sel1L protein levels in the gut, with quantitation shown on the right (n=3 mice for EKO;Ire1a+/− and n=2 for the rest). Each lane represents an independent sample. αTubulin, a loading control. Unprocessed original scans of blots are shown in Supplementary Fig. 9. (e) Q-PCR analysis of BiP mRNA levels in the gut. Error bars represent sem, n=3 mice of each genotype. (f) Q-PCR analysis of Chop mRNA levels in isolated colon epithelium of WT and Sel1LΔIEC mice. Error bars represent sem, n=3 mice of each genotype. (g–i) The experiments and data presentation are the same as those shown above in (a-c), with the exception that EKO;Chop−/− and their control cohorts were characterized. Error bars represent sem from n=6 mice of each genotype pooled from two independent experiments. n.s., not significant. *, p<0.05; **, p<0.01; ***, p<0.001 by Student’s two-tailed t test. (j) Our model: Sel1L-Hrd1 ERAD degrades IRE1α protein, thereby restraining IRE1α activation and signaling. Subsequently, IRE1α signaling modulates inflammation and the pathogenesis of experimental colitis. The finding reported in this study is shown in red.

