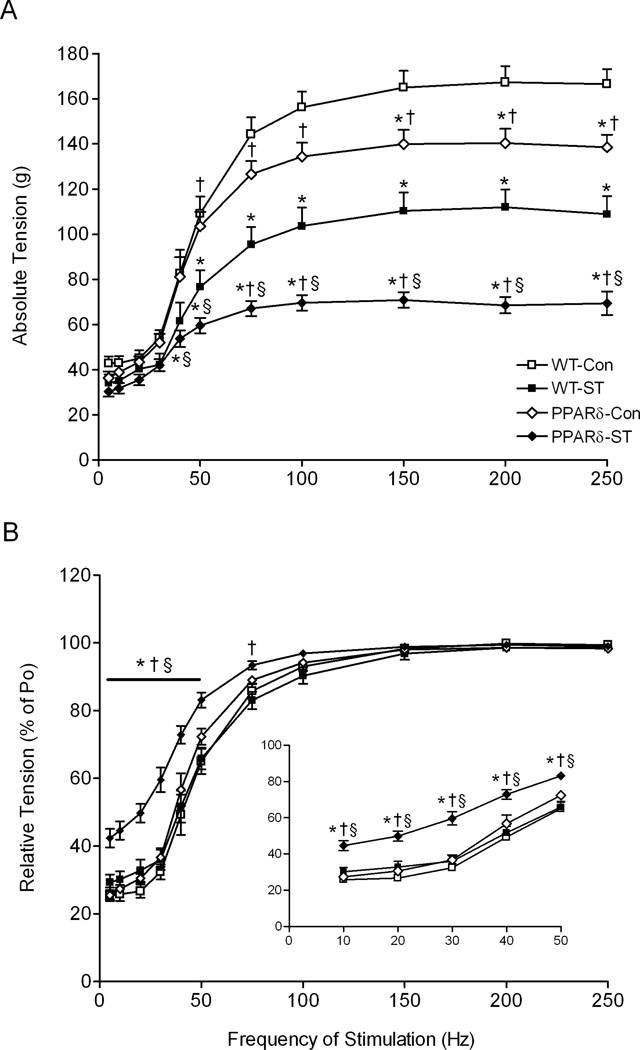
Figure 3.
Absolute (A) and relative [% of maximum tetanic tension (B)] frequency of stimulation-tension responses for the MG muscles for the WT-Con, WT-ST, PPARδ-Con, and PPARδ-ST groups at the end of the 4-week experimental period. Inset in (B) is the expanded relative frequency of stimulation-tension response from 10 to 50 Hz. Values are shown as means ± SEM. Po, maximum tetanic tension. *, †, and § denote a significant difference from WT-Con, WT-ST, and PPARδ-Con groups, respectively, at P < 0.05.

