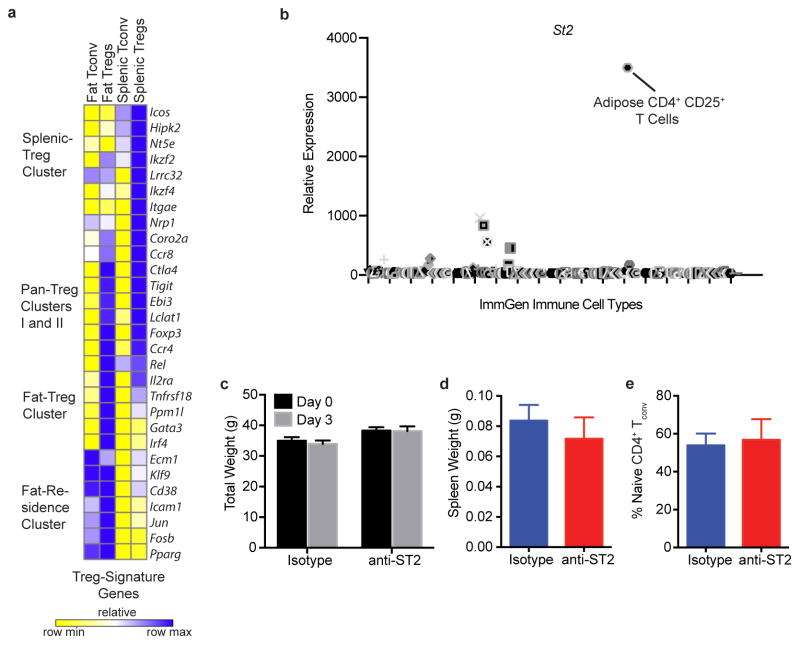
Extended Data Figure 8.
fTreg gene expression and depletion with anti-ST2 antibody treatment. (a) Expression of several canonical Treg genes across fat and splenic Tregs and fat and splenic Tconv cells. Cells were pooled from 3 and 4 mice before isolating RNA for subsequent RNA-Seq analysis. (b) Expression of ST2 across all hematopoietic cells catalogued in the ImmGen database. Position of adipose CD4+ CD25+ T cells is marked. (c) Total weight before beginning course of anti-ST2 or isotype control antibodies (Day 0) and upon terminal analysis (Day 3). Spleen weight (d) and percentage of splenic naive CD4+ T cells as defined by CD62hi CD44lo relative to total splenic CD45+ CD4+ CD25− T cell population (e) of mice upon terminal analysis (Day 3, n=4 mice per group). Data represents mean ± s.e.m.

