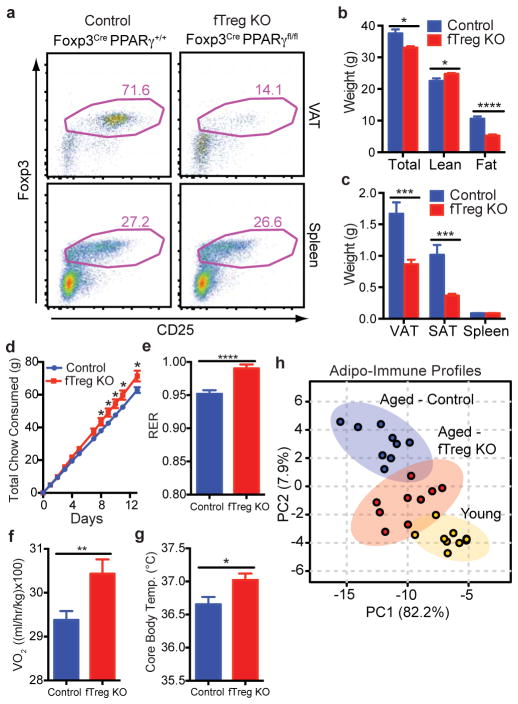
Figure 2. fTreg KO mice are protected from general hallmarks of metabolic aging.
(a) Representative FACS plots of fTreg KO (Foxp3Cre PPARγfl/fl) and control (Foxp3Cre PPARγ+/+) mice depicting Treg enrichment in VAT and spleen (~15 months, CD45.2+ CD4+ gating). (b) Total body weight (n=15 per group), and lean and fat mass of control and fTreg KO mice (~12 months, n=8 per group). (c) Mass of VAT, SAT, and spleen in aged control and fTreg KO mice (~15 months, n=9 per group). (d) Cumulative food consumption of control and fTreg KO mice (~8–9 months old, n=8 per group). (e–f) Average 24 hour respiratory exchange ratio (RER) of (e) and average VO2 consumed by (f) aged control and fTreg KO mice (~11 months, n=6 per group) (g) Core body temperature of control and fTreg mice (~13 months old, n=9 per group). (h) Principal component analysis of non-macrophage AIPs of young (12 weeks), aged (~15 months) and aged-fTreg KO (~15 months) mice. Data represents mean ± s.e.m. *p<0.05, **p<0.01, ***p<0.001, ****p<0.0001.

