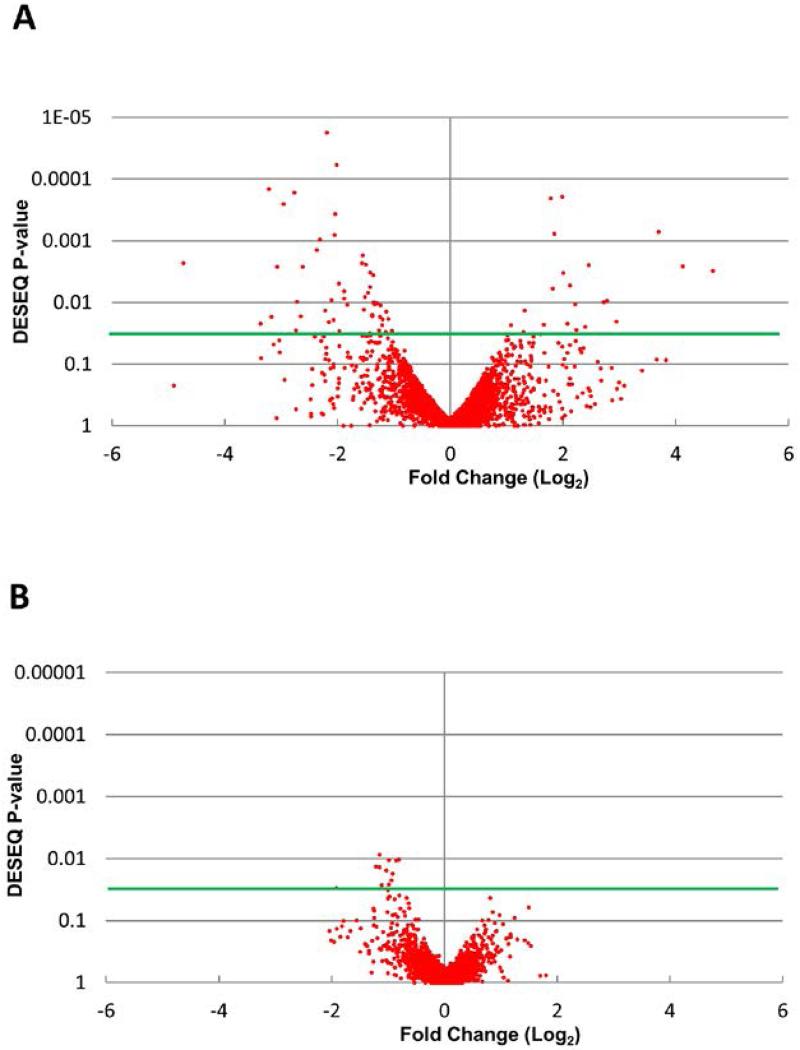
Fig. 4.
Distribution of differentially regulated genes of C. albicans and S. gordonii following co-incubation for 1 h at 37°C. RNA was extracted and gene transcriptional levels were determined following Ilumina HISeq2500 sequencing. The transcriptional profiles were constructed and analyzed using the statistical software DESeq. Volcano plots of P-value vs. mean fold change in gene expression were constructed for C. albicans genes when incubated with S. gordonii (A) and S. gordonii genes when incubated with C. albicans (B). Green horizontal lines represent P = 0.05.

