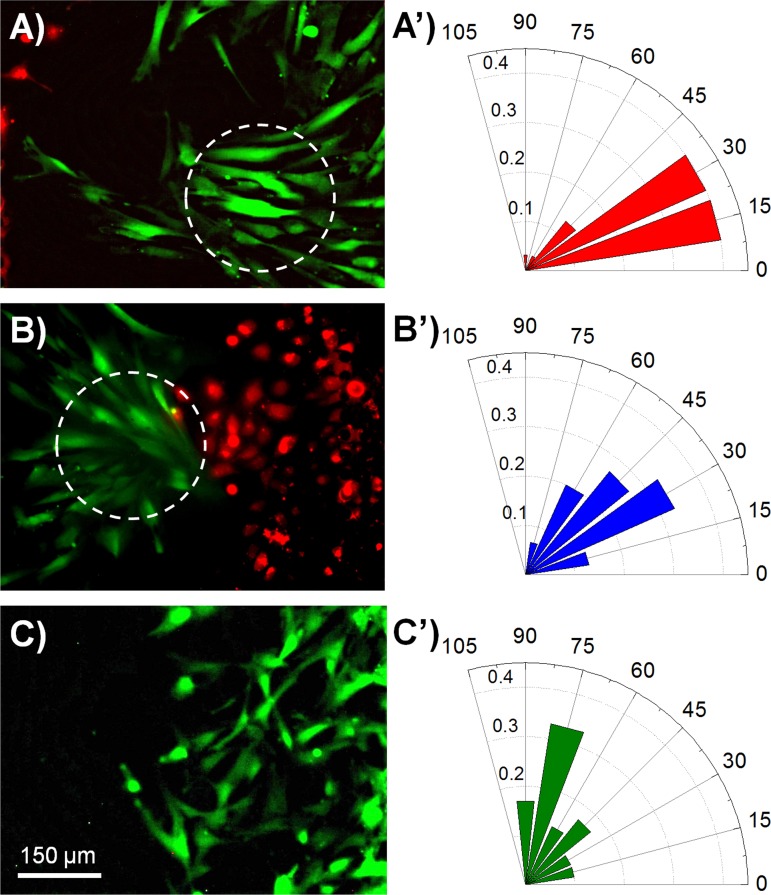
FIG. 7.
Comparison of the migration direction of ESF-1 cells in the co-culture and mono-culture during the wound healing. (a) Fluorescence image of ESF-1 cells during HaCaT, ESF-1, and HUVEC cell co-culture, showing ESF-1 cells migrated towards HaCaT cells. (b) Fluorescence image of ESF-1 cells during HaCaT, ESF-1, and HUVEC cell co-culture, showing that ESF-1 cells migrated towards HUVEC cells. (c) Fluorescence image of ESF-1 cells during their mono-culture, showing that ESF-1 cells migrated towards the wound. (a')–(c') The orientation of ESF-1 cells in the co-culture and mono-culture during the wound healing, corresponding to (a), (b), and (c), respectively. The direction of each bar in the rose plots indicates the angular ESF-1 cell orientation, whereas the magnitude of each bar shows the fraction of cells with the indicated ESF-1 cell orientation.

