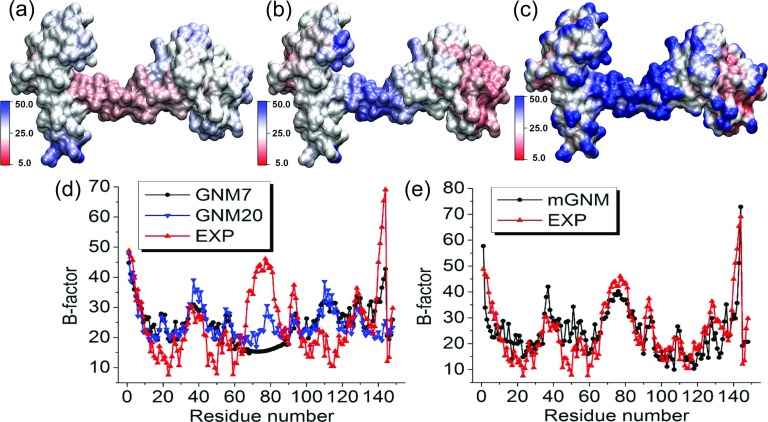
FIG. 9.
The comparison between Type-2 mGNM with exponential kernel and traditional GNM for the B-factor prediction of protein 1CLL. Two scales, i.e., η1 = 3 Å and η2 = 25 Å, are employed in mGNM. (a) Molecular surface colored by B-factors predicted by GNM with cutoff distance 7 Å. (b) Molecular surface colored by B-factors evaluated by our Type-2 mGNM. (c) Molecular surface colored by multiscale flexibility function in Equation (18). (d) B-factors predicted by traditional GNM with cutoff distances 7 Å (GNM7) and 20 Å (GNM20). (e) B-factors predicted by mGNM.

