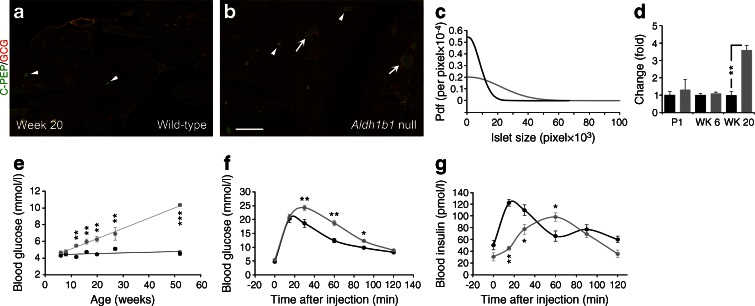
Fig. 4.
Aldh1b1 tm1lacZ null mice have larger islets but are glucose intolerant and develop age-dependent hyperglycaemia. (a, b) Double immunofluorescence for C-PEP and glucagon (GCG) indicated the presence of both normal-sized islets (arrowheads) and significantly larger islets (arrows) in Aldh1b1 tm1lacZ null mice compared with wild-type mice. (c) Morphometric analysis and plotting of the islet size probability density function (pdf) illustrates the significantly larger Aldh1b1 tm1lacZ null median islet size (3,223) compared with the wild-type (1,413) (black line, wild-type; grey line, null) at week 20. Sizes are expressed in pixels (100 μm = 135 pixels). Differences in the distribution are significant (p < 0.001). (d) Beta cell mass differences are negligible at P1 and week 6 (WK 6) but there is a 3.6-fold increase in the beta cell mass of the Aldh1b1 tm1lacZ compared with that of wild-type at week 20 (WK 20) (black bars, wild-type; grey bars, null). **p < 0.01 for the indicated comparison. (e) Blood glucose levels after overnight fasting in 6- to 52-week-old mice showed that Aldh1b1 tm1lacZ nulls gradually develop hyperglycaemia (black line, wild-type; grey line, null) (n = 8–20). (f) Aldh1b1 tm1lacZ nulls show a significant delay in blood glucose clearance during IPGTT at week 8 (n = 8, 7) (black line, wild-type; grey line, null). (g) Acute insulin secretion during IPGTT is impaired at WK 8 in Aldh1b1 tm1lacZ null mice compared with wild-type mice (n = 5) (black line, wild-type; grey line, null). Results in (a–d) are from three animals per genotype and per age group, and values are representative of 25 sections spanning the entire pancreas of each animal. Results in (e–g) are from the indicated number of animals (n) per genotype. Values are mean ± SEM. *p < 0.05, **p < 0.01 and ***p < 0.001, Aldh1b1 tm1lacZ null vs wild-type. Scale bar, 1.5 mm

