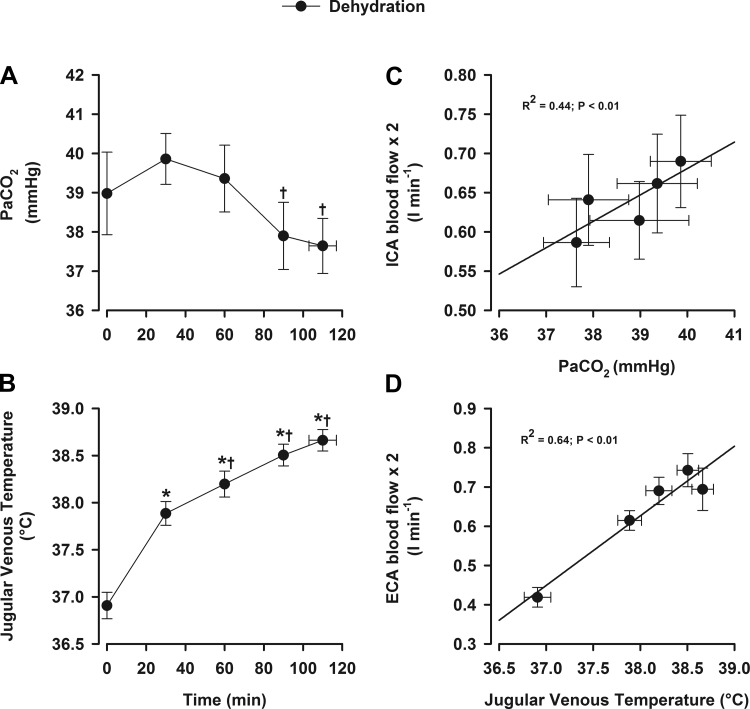
Fig. 4.
Blood temperature, arterial Pco2 (PaCO2), and relationships with blood flow during prolonged exercise. Values are means ± SE for 10 participants. Data presented are from the dehydration trial. Relationships were obtained using multiple regression for within-subject repeated measures. A: PaCO2. B: jugular venous temperature. C: ICA blood flow. D: ECA blood flow. *P < 0.05 vs. rest; †P < 0.05 vs. the 30-min value.

