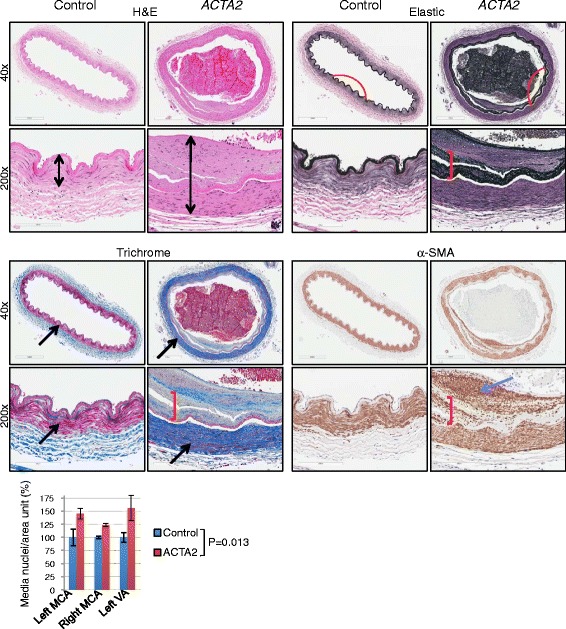
Fig. 3.

Large artery changes in ARCD. Serial sections of left MCA labeled with H&E, elastic and trichrome special stains and with α-SMA IHC show thickened arterial walls (double headed arrows), flattening (red curve), splitting and disorganization (red bracket) of the internal elastic lamina, marked fibrosis of the media (black arrows) where SMCs stain red and increased collagen stains blue with Trichrome, and SMC proliferation (blue arrow) of intima in the ACTA2 mutant as compared to control. The numbers of SMC nuclei from the media of the indicated large cerebral arteries were counted on random fields from H&E sections, normalized to area and expressed as mean ± SD. Control and mutant groups for each artery were compared by t-test
