Fig. 2.

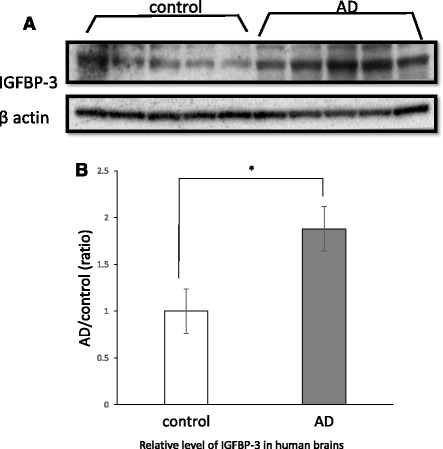
IGFBP-3 expression in human brains. Brain homogenates of temporal cortexes from AD patients (AD, n = 5) and age-matched non-AD controls (control, n = 5) were analyzed via western blot using anti-IGFBP3 and β-actin antibodies (a). The band densities were quantified using Image J. The IGFBP3/β-actin ratio was calculated and analyzed using Mann-Whitney’s U test. The IGFBP3/β-actin ratio was significantly increased in the brains of AD patients (b, 188.1 ± 23.9 %, p < 0.05). The data represent the mean ± SE. * indicates statistically significant differences (*p < 0.05)
