Fig. 6.

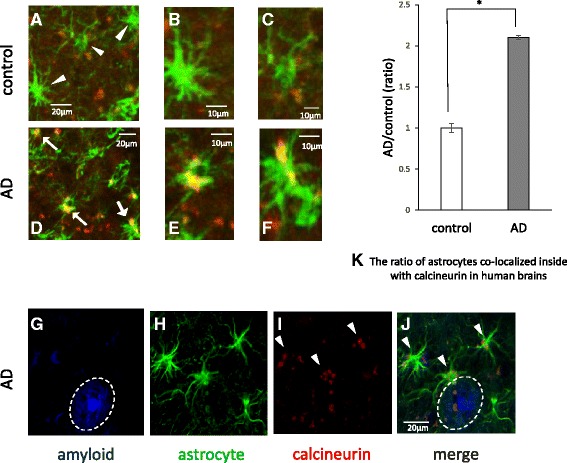
Calcineurin in astrocytes from human brains. Confocal merged images of the double-fluorescence immunohistochemical study of GFAP (green) and calcineurin (CaN) (red). Representative images from a control brain (a-c) and an AD brain (d-f) are shown. B, C, E and F are higher magnification images. Little CaN was found in astrocytes from control brains (a-c), whereas increased expression of CaN was observed in astrocytes from AD patients (d-f) Triple-fluorescence labeling of β-amyloid with FSB (blue) (g), GFAP (green) (h) and CaN (red) (i) in AD brains revealed the upregulation of CaN in astrocytes (I and J, white arrow) in the proximity of Aβ plaques (g and j, white circle). We took nine independent randomly chosen low magnification images from each of four patients and counted the number of astrocytes that expressed CaN out of the total number of astrocytes. More astrocytes express CaN in AD brains than in control brains (n = 5, 210.3 ± 2.2 %, p < 0.05). The data represent the mean ± SE. * indicates statistically significant differences (*p < 0.05). These human brain samples were from the temporal cortex
