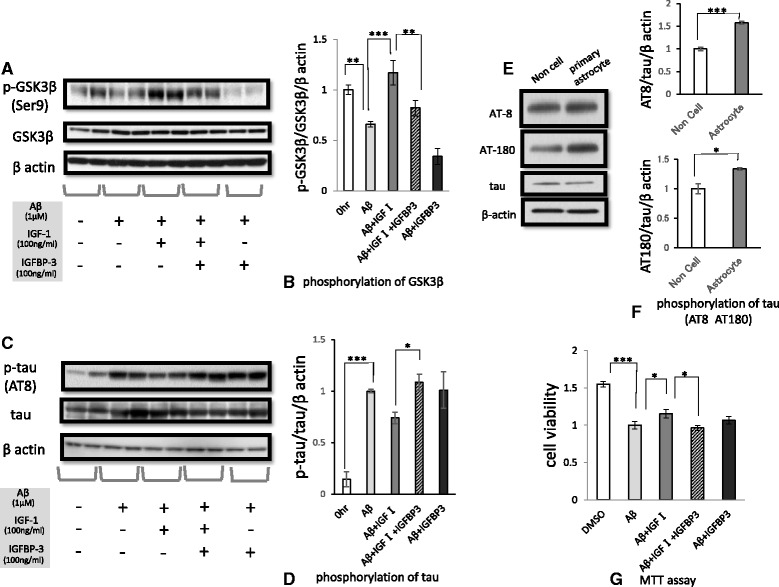
Fig. 7.

The effects of IGFBP-3 on the phosphorylation of GSK-3β and tau, and on cell death. Primary murine neurons were treated with Aβ1–42 (1 μM), IGF-1 (100 ng/ml) and IGFBP-3 (100 ng/ml), as designated in the figure, for 48 h. Western blotting analysis of primary murine neurons revealed that Aβ reduced the inhibitory phosphorylation of GSK-3β at Ser9 (n = 6, p < 0.01), but IGF-1 restored the level of Ser9 phosphorylation (a and b, p < 0.001). The ratio of phosphorylated GSK3β to the total, normalized by β actin, is shown, converting the value of pre-treatment into 1(b). IGFBP-3 precluded IGF-induced Ser9 phosphorylation (p < 0.01). On the other hand, Aβ induced tau phosphorylation of murine primary neurons after 48 h of treatment (c and d, n = 6, p < 0.001). The ratio of phosphorylated tau to the total, normalized by β actin, is shown, converting the value of pre-treatment into 1(d). Although IGF-1 suppressed tau phosphorylation, IGFBP-3 counteracted the effect of IGF-1 (c and d, p < 0.05).To examine phosphorylation of tau in murine primary neuron when treated by astrocyte-cultured media, two dishes were prepared, one on which primary astrocytes spread and the other on which no cell spread. The culture medium was each collected after a 48-h treatment with 1 μM Aβ. Primary neurons were treated with the media which added 100 ng/ml IGF-Ι for 48 h and subjected the cell lysate to western blot. Astrocyte-cultured media induced tau phosphorylation in primary murine neurons in comparison to the control.as detected by both the AT8 antibody and AT180 antibody (e). The ratio to the control of AT8 (n = 3 157.34 ± 3.44 %, p < 0.001) and AT180 (n = 3 133.63 ± 1.96 %, p < 0.05), respectively, are shown, which value was corrected by total tau and βactin (f). Primary murine neurons were treated with Aβ1–42, IGF-1 and IGFBP-3 for 72 h and subsequently were subjected to an MTT assay to examine cell death (n = 16). IGF-1 attenuated the neuronal cell death induced by Aβ (155.1 ± 5.7 %, p < 0.05), but IGFBP-3 inhibited the pro-survival effect of IGF-1 (g, p < 0.05). The data represented by the mean ± SE. * indicates statistically significant differences (*p < 0.05, **p < 0.01, ***p < 0.001)
