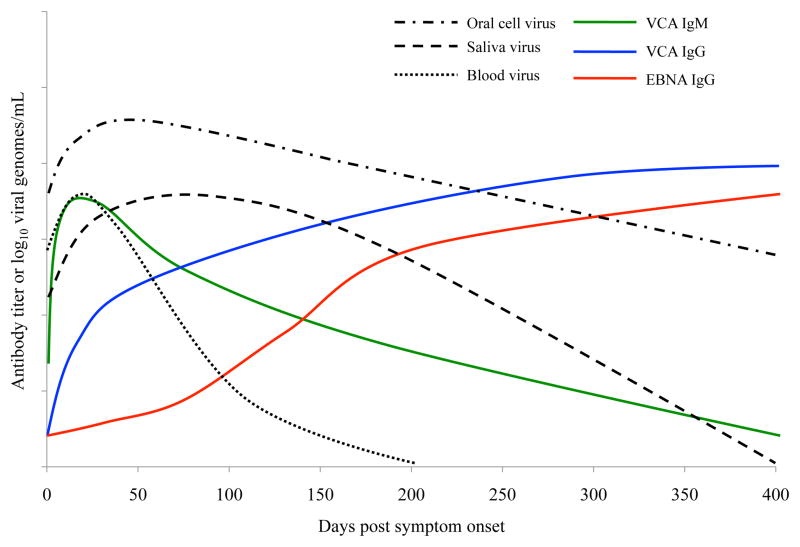
Figure 1. Kinetics of EBV viral load and antibody responses in subjects with primary EBV infection.
Depicted are viral loads in whole blood, saliva, and oral cell pellets (black lines) as well as IgM and IgG antibodies to VCA and IgG to EBNA1 (colored lines). Note: the limit of detection of the EBV viral genomes in blood was 200 copies per mL of whole blood.

