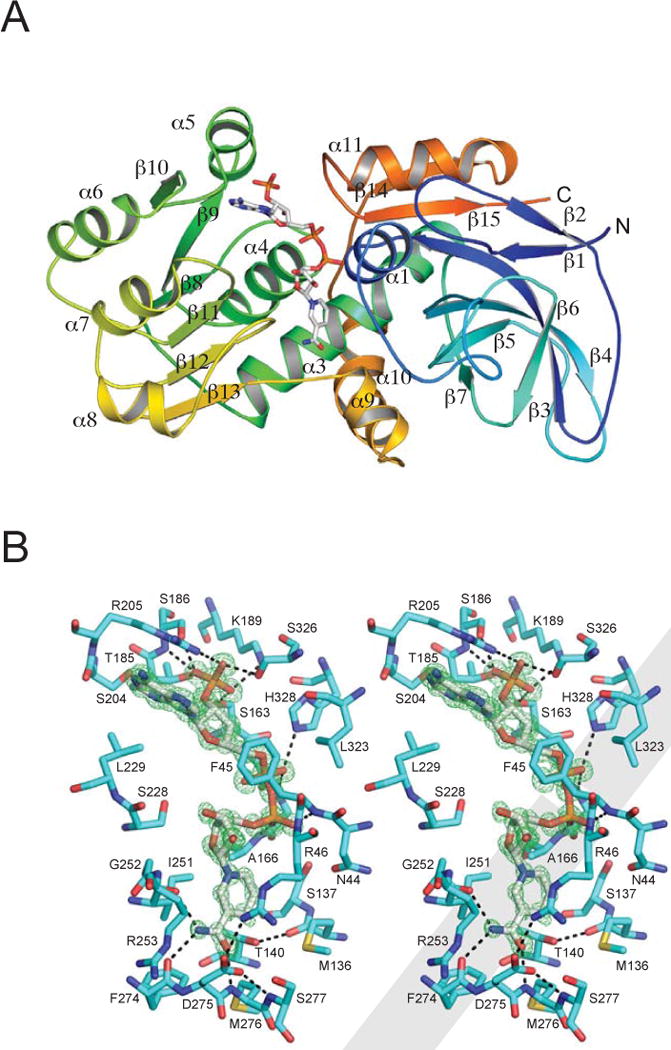
Figure 2.

A. Overall structure of CurF ER. The polypeptide in the ribbon diagram is colored as a rainbow from blue (N-terminus) to red (C-terminus) and secondary structures are labeled. Cofactor NADP+ is shown as sticks with atomic colors (white C, red O, blue N, orange P).
B. Cofactor binding in CurF ER. The stereo view shows the environment around the cofactor NADP+ (Fo−Fc omit map at 0.96-Å resolution contoured at 4σ in green). NADP+ and the neighboring residues are shown as sticks (white C in NADPH; cyan C in the protein). Hydrogen bonds are shown as black dashed lines.
