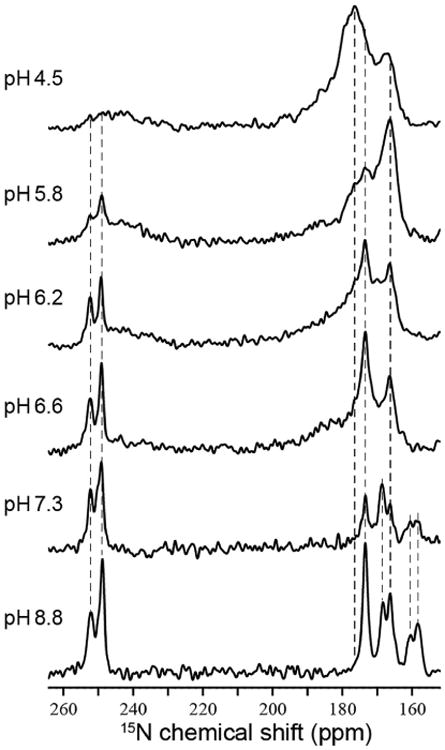
Figure 1. pH Titration of the His37-Labeled M2FL at-10°C Using 1D 15N MAS NMR Spectra at 600 MHz for 1H and 12.0 kHz.

To optimize the signal-to-noise ratio for both NH and Nnon-H signals, low-pH samples used longer cross-polarization contact time than high pH samples during data collection. Dashed lines are drawn to help show spectral changes or lack thereof in the frequencies as a function of pH. Contact times: pH 4.5, 5 ms; pH 5.8, 5 ms; pH 6.2,5 ms; pH 6.6, 4 ms; pH 7.3, 2.5 ms; pH 8.8, 1.6 ms. See Figure S1 for a plot of the pH titration.
