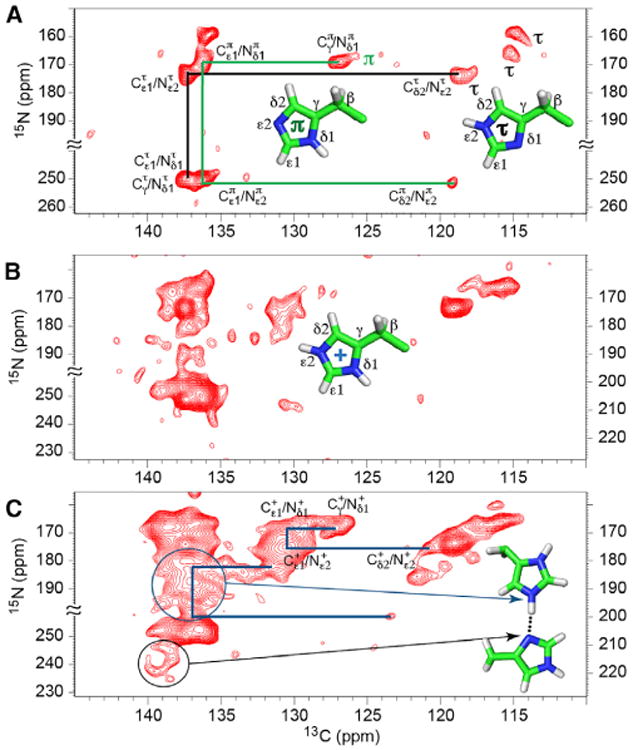
Figure 3. 2D 15N-13C zf-TEDOR Spectra of His37-Labeled M2FL at Different pH Values Collected at −10°C.

The total TEDOR mixing time of 1–1.3 ms was used to obtain one-bond 15N-13C correlations. Structures of the π, τ, and charged states of the His residues are displayed.
(A) pH 7.3. Three τ and one π are labeled. Only the assignments for one τ (black) and the observed π (green) tautomers are traced in the figure. The assignments of the other τ tautomers can be similarly traced.
(B and C) The pH 6.6 (B) and pH 6.2 (C) spectra were obtained with 15N frequency folded about 228.1 ppm (pH 6.2) and 227.3 ppm (pH 6.6). “≈” indicates bounds of the folded frequency range. The scales on the lower left and on the right are for nonprotonated and protonated nitrogens, respectively. The presence of charged histidine resonances is evident, and considerable heterogeneity is apparent among the neutral tautomer resonances. In (C), examples of traced resonance patterns for charged tautomers (blue lines) are illustrated as in (A) for the neutral tautomers. Resonances generated from multiple imidazolium-imidazole hydrogen-bonded nitrogen sites are circled. The black circle includes multiple nonprotonated nitrogen resonances associated with these hydrogen bonds, while the blue circle includes multiple resonances associated with the protonated nitrogen resonances associated with these hydrogen bonds.
