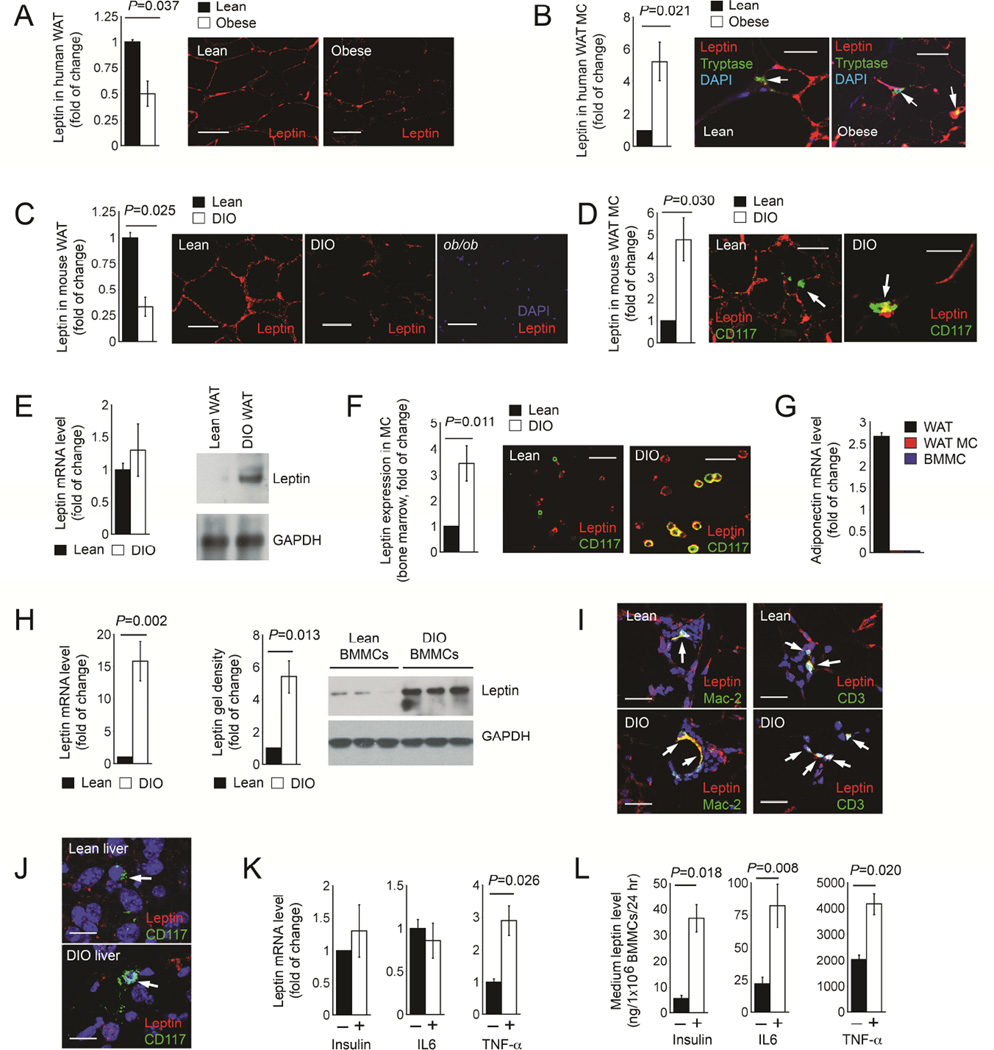
Figure 1.
Leptin expression in lean and obese humans and mice. A. Leptin immunofluorescent staining of WAT from lean and obese humans. B. Leptin and MC tryptase immunofluorescent double staining of WAT from lean and obese humans. C. Leptin immunofluorescent staining of WAT from lean and DIO mice. D. Leptin and CD117 immunofluorescent double staining of WAT from lean and DIO mice. E. RT-PCR (left) and immunoblot (right) detected leptin expression in MCs isolated from lean and DIO WAT. F. Leptin and CD117 immunofluorescent double staining of total bone marrow cell preparation from lean and DIO mice. G. RT-PCR detected adiponectin expression in WAT, purified MCs from WAT, and BMMCs, all from lean mice. H. RT-PCR (left) and immunoblot (right) detected leptin expression in BMMCs prepared from lean and DIO mice. GAPDH in panels E and H ensured equal protein loading. I. Leptin and Mac-2 or CD3 immunofluorescent double staining of WAT from lean and DIO mice. J. Leptin and CD117 immunofluorescent double staining of liver from lean and DIO mice. RT-PCR (K) and culture medium ELISA (L) detected leptin expression in WT BMMCs with different treatments as indicated. N=17 per group for human WAT samples, n=12 per group for mouse WAT and liver samples, n=3~6 for RT-PCR, and n=6 for leptin ELISA. Representative data for panels A-D, F, and H are shown to the right. Scale: 50 µm.

