Abstract
Objective
The activation state of the systemic inflammatory milieu has been proposed as a critical regulator of vascular repair following injury. We evaluated the early inflammatory response following endovascular intervention for symptomatic peripheral arterial disease to determine its association with clinical success or failure.
Methods
Blood samples were obtained from patients (N=14) undergoing lower extremity angioplasty/stenting and analyzed using high-throughput gene arrays, multiplex serum protein analyses, and flow cytometry.
Results
Time-dependent plasma protein and monocyte phenotype analyses demonstrated endovascular revascularization to have a modest influence on the overall activation state of the systemic inflammatory system, with baseline variability exceeding the perturbations induced by the intervention. In contrast, specific time-dependent changes in the monocyte genome are evident in the initial 28 days, predominately in those genes associated with leukocyte extravasation. Investigating the relationship between inflammation and the one-year success or failure of the intervention showed no single plasma protein to be correlated with outcome, but a more comprehensive cluster analysis revealed a clear pattern of protein expression that was closely related to the clinical phenotype. Corresponding examination of the monocyte genome identified a gene subset at one-day post-procedure that was predictive of clinical outcome, with a majority of these genes active in cell cycle signaling.
Conclusions
Although the global influence of angioplasty/stenting on systemic inflammation was modest, both circulating cytokine and monocyte genome analyses support a pattern of early inflammation that is associated with ultimate intervention success versus failure. Molecular profiles incorporating genes involved in monocyte cell cycle progression and homing, and/or pro-inflammatory cytokines offer the most promise for the development of class prediction tools for clinical application.
Introduction
Driven by the rising incidence of symptomatic peripheral artery disease (PAD)1 and continuing improvements in technology, endovascular therapies for infrainguinal occlusive disease have increased exponentially over traditional open surgery.2,3 This presents new challenges since, despite these advances, the durability of endovascular intervention remains limited due to accelerated failure secondary to aberrant vascular remodeling.4 Following endovascular intervention, the activation state of the systemic inflammatory system has been shown to be a critical component of the early response to injury,5 and the interplay of local and systemic factors determines either a maladaptive, occlusive phenotype leading to intervention failure, or more favorable outward remodeling and a patent intervention. While animal models have implicated a wide-range of important mediators in the remodeling process, patient-specific data is limited.6,7
Systemic inflammation significantly influences outcomes in surgical patient populations, especially in trauma and emergency general surgery where exaggerated systemic inflammation is associated with increasing morbidity and mortality.8 Adherence to strict guidelines to identify and address this immune dysfunction has been shown to be associated with a significant reduction in hospital mortality rates.9 Emanating from these concepts, the multicenter NIH-funded “glue” grant (Inflammation and the Host Response to Injury) was developed to better understand this complex inflammatory response to traumatic injury by utilizing genome-wide microarray technologies and high throughput proteomics.10 Rather than focusing on specific genes or proteins, these investigators endorsed a discovery-type approach, which has detailed the complex recovery path associated with major trauma and identified a discrete set of genes that define the various outcome phenotypes.11
Thus formed the basis our current study in which we sought to define the early systemic inflammatory response following endovascular intervention using a comprehensive approach consisting of high throughput gene array technology, multiplex serum protein analyses, and flow cytometry. We hypothesized that early activation of circulating monocytes, increases in monocyte pro-inflammatory gene expression, and up-regulation of pro-inflammatory proteins are critical determinants of clinical success or failure.
Materials and Methods
Study Design
The detailed study design has been previously published.12 Briefly, patients undergoing lower extremity angiography for the clinical indication of disabling claudication or critical limb ischemia (Rutherford Category 3 – 5), were offered participation in this prospective study. The project was approved by the Institutional Review Board at the University of Florida and the Malcom Randall VA Medical Center and all patients provided informed consent.
Angiography was performed using a percutaneous, femoral approach under local anesthesia, and the TransAtlantic Inter-Society Consensus (TASC-II) recommendations were used to guide clinical decision-making.13 Patients with infrainguinal disease including TASC A through C superficial femoral artery (SFA) lesions and limited popliteal and tibial outflow disease were considered for endovascular therapy. Primary balloon angioplasty was performed for SFA stenoses, while subintimal recanalization with angioplasty was performed for chronic total occlusions. Placement of a bare metal self-expanding nitinol stent was reserved for unacceptable results following angioplasty. Concurrent popliteal and tibial stenoses greater than 50% were managed with primary angioplasty. Unless contraindicated, all patients were administered clopidogrel (300 mg) one hour post-procedure. Combination therapy of clopidogrel (75mg) and aspirin (81 mg) was prescribed, or patients on warfarin continued their normal dosing schedule with the addition of clopidogrel (75 mg), for 30 days.
Follow-up (1 week, 1, 6, and 12 months) included symptom assessment, pulse examination with ankle-brachial indices (ABI), and duplex arterial ultrasound examination. Clinical failure was defined as: angiographic or duplex evaluation demonstrating occlusion or high-grade stenosis (greater than a 3.5-fold increase in peak systolic velocity) at the site of intervention, an associated interval decrease in ABI > 15% with return of clinical symptoms, or the need for secondary intervention of the index lesion. Chi-square, Fisher’s exact, or Student t-test was used for statistical comparison of clinical and procedural variables (SPSS V.21; Chicago, IL).
Case - Control Study Design
To provide the most comprehensive analysis of temporal variations across multiple domains of the systemic inflammatory system, a case-control analysis scheme was utilized. Matching the six cases of primary failure at one-year, a control group of eight cases (from eighteen) demonstrating successful one-year patency were identified. Each failed intervention was individually matched to one or more controls by age, comorbidities, disease severity, and procedural variables. Cases and controls were required to be within a tolerance limit of ten years of age and required an explicit match for adjuvant stent placement. The set of controls matching any case by the above criteria was partitioned into disjoint matched sets by optimal full matching as previously described.14 Demographic and procedural characteristics of the eight success and six failure patients used in subsequent analyses demonstrate reasonable comparability across all domains (Tables 1 and 2). Additional demographic detail for the entire 24 patient cohort is provided in the supplemental materials (Supplemental Tables 1 and 2).
Table 1.
Patient characteristics and co-morbidities (Case-Control)
| Variables | Success | Failure | p-value* |
|---|---|---|---|
| Patients | 8 | 6 | |
| Age, mean ± SD, years | 64.3 ± 8.6 | 60.2 ± 6.3 | 0.23 |
| Male | 8 (100) | 6 (100) | 1.0 |
| Comorbidities | |||
| CAD | 3 (37.5) | 2 (33.3) | 1.0 |
| CHF | 1 (12.5) | 0 (0) | 1.0 |
| Diabetes | 3 (37.5) | 3 (50) | 1.0 |
| Hypertension | 8 (100) | 6 (100) | 1.0 |
| Dyslipidemia | 7 (87.5) | 6 (100) | 1.0 |
| Renal insufficiency† | 0 (0) | 0 (0) | 1.0 |
| Past/current smoker | 8 (100) | 6 (100) | 1.0 |
| Medications‡ | |||
| Aspirin | 8 (100) | 6 (100) | 1.0 |
| Plavix | 7 (87.5) | 5 (83.3) | 1.0 |
| Warfarin | 1 (12.5) | 0 (0) | 1.0 |
| Aggrenox | 1 (12.5) | 0 (0) | 1.0 |
| Statin | 8 (100) | 4 (66.7) | 0.16 |
| Cilostazol | 3 (37.5) | 1 (16.7) | 0.58 |
| Steroids | 0 (0) | 0 (0) | 1.0 |
Categorical data are shown as number (%) and continuous data as mean ± standard deviation
CAD, coronary artery disease; CHF, congestive heart failure
χ2 or t-test, where appropriate
Creatinine > 1.8
Medications on discharge following procedure
Table 2.
Patient and procedural characteristics
| Feature | Success | Failure | p-value* |
|---|---|---|---|
| Preop ABI | 0.68 ± 0.15 | 0.59 ± 0.16 | 0.39 |
| Postop ABI | 1.01 ± 0.05 | 0.89 ± 0.024 | 0.29 |
| Indication | |||
| Claudication | 6 | 4 | |
| Rest pain | 0 | 0 | |
| Tissue loss | 2 | 2 | 1.0 |
| Procedure | |||
| PTA | 2 | 2 | |
| PTA+Stenting | 6 | 4 | 1.0 |
| Intervention Site | |||
| SFA | 8 | 6 | |
| Popliteal | 0 | 2 | |
| Tibial | 1 | 1 | 0.72 |
| TASC II class | |||
| A | 4 | 1 | |
| B | 2 | 5 | |
| C | 2 | 0 | |
| D | 0 | 0 | 0.11 |
Categorical data are shown as number (%) and continuous data as mean ± standard deviation
ABI, ankle-brachial index; PTA, percutaneous transluminal angioplasty; SFA, superficial femoral artery; TASC, TransAtlantic Inter-Society Consensus
Fisher’s exact or t-test, where appropriate
Sample Collection and Plasma Protein Analysis
Blood samples were collected one hour prior to the procedure, and 2 hours, 1 day, 7 days, and 28 days post-procedure. Plasma was isolated from whole blood, stored at −80°C, and analyzed in duplicate using the Milliplex MAP Multiplex Assays (Millipore, Billerica, MA). Time-dependent changes in plasma protein content and the effect of these changes on clinical outcomes were analyzed with the R statistical software package (Vienna, Austria; V.2.15.0) using a mixed linear model, with protein level as outcome and time, clinical outcome, and the interaction between time and outcome as fixed factors. We considered patient a random factor and modeled a random intercept for each patient. A random slope was tested for each patient and was included in the model if it improved overall model fit. Time was treated as a continuous variable. As necessary, to account for non-constant variance, a variance power function was utilized or separate variances were modeled for the groups. To control for multiple comparisons, a Bonferroni-adjusted cutoff for significance of .0024 was used. In addition, univariate analyses between outcome groups were performed for all proteins at the pre-op and 1 day time points. dChip software (Harvard, Boston, MA) was used for hierarchal clustering analyses and heatmap generation.
The dynamic trajectory of the plasma protein levels and their relationship to intervention success or failure were further examined using our previously published clustering algorithm.15,16,17 Unique to this approach, the intrinsic model structure integrates time-dependent correlations to optimize the statistical process, thereby increasing the power to detect significantly differentiated patterns of expression. Potential cluster numbers are evaluated through use of a Bayesian information criterion (BIC), with the optimum cluster number defined by minimizing the BIC through a range of cluster and Legendre orthogonal polynomial order combinations.
Monocyte RNA Isolation and Microarray Analysis
Monocytes were isolated by negative selection using a commercial preparation (RosetteSep, StemCell Technologies, Vancouver, BC, Canada). RNA isolation was performed using RNeasy MiniKit (QIAGEN, Valencia, CA), and quality was assessed using an Agilent Bioanalyzer. cDNA was generated using Ovation Pico WT kit (NuGEN, San Carlos, CA) and labeled using GeneChip WT Terminal Labeling (Affymetrix, Santa Clara, CA).
Samples were hybridized to a proprietary Glue Grant Human Transcriptome Array (GGH2, Affymetrix). The construct of this array is described in detail in the original descriptive publication.18 Briefly, it is a 6.9 million-feature oligonucleotide array of the human transcriptome designed and validated for comprehensive examination of gene expression at both the gene and exon level. This is the primary feature utilized in this study. In addition, the GGH2 array allows genome-wide identification of alternative splicing and detection of coding SNPs and noncoding transcripts. The array has been validated in a multicenter clinical program and has generated high-quality, reproducible data.11 Permission for use of the GGH2 array was granted by the Glue Grant Advisory Committee.
The resulting expression data was normalized with Partek Genomics Suite (Partek, St. Louis, MO) and hierarchal clustering was performed using dChip software. Time series and class prediction analyses were performed using BRB-Array Tools (NIH, Biometric Research Branch).19 For time course analyses, a quadratic function was fit to the expression data of each gene and the null-hypothesis that the linear and quadratic coefficients are simultaneously zero was tested (False Discovery Rate (FDR) <.05). The resulting genes were those for which there is statistical evidence of a relationship between time and average gene expression. The class prediction analysis incorporated the differentially expressed genes at the .001 significance level as assessed by the random variance t-test. Using these genes, a model was developed based on the K-nearest neighbor (K=1 and 3) classification to predict the class (outcome) of future samples.20 Due to small sample sizes and lack of an independent data set for validation, a leave-one-out cross validation method was employed. Lastly, a statistical significance test of the cross-validated misclassification rate based on 1000 random permutations (Monte Carlo method) was performed to minimize the probability that the association between outcome and expression profile occurred by random chance alone.21 Ingenuity Pathway Analysis (IPA; QIAGEN, Redwood City, CA) software was utilized for core pathway analysis of significant genes. The Benjamini-Hochberg method was utilized to calculate multiple-testing corrected P-values to control the rate of false discoveries.22 An FDR-adjusted P-value of .05 was used to determine significant ontology and pathway enrichment.
Flow Cytometry and Monocyte Phenotype Determination
Following application of a rat anti-mouse CD16/CD32 monoclonal antibody (Fc block, Becton Dickinson, San Jose, CA), whole blood (200 µl) was incubated for 15 minutes with the following antibody combinations (CD14/CD11b/CD16/CD18/CD162/HLADR; CD14/CD11a/CD16/CD18/CD162/HLADR). FACS Diva Software (Becton Dickinson) was used to differentiate monocyte phenotype based upon surface marker expression and forward and side scatter characteristics.
Results
Demographics and Clinical Outcomes
Forty patients consented to participate in the study with 24 undergoing a qualifying endovascular intervention for inclusion in the current analysis. All patients were male with a mean age of 63.3 ± 6.7 years. The primary indication for intervention was disabling claudication (N=18), with a small number of patients presenting with critical limb ischemia – rest pain (N=1) and tissue loss (N=5). Seven patients underwent balloon angioplasty alone while the remaining 17 patients underwent angioplasty with stenting. Consistent with the entry criteria, all patients had intervention of the SFA, while 4/24 patients required concomitant distal intervention. Technical success was 100%. Median follow-up for this group was 22.7 months [lower quartile 371.25d, upper quartile 1379.5d; IQR 1008.25d], with 22/24 patients followed for a minimum of one year. Two patients were lost to follow-up following failure of their intervention. Cumulative one- and two-year primary patency was 79% and 66% respectively, while one- and two-year secondary patency was 83% and 76%, respectively. Detail regarding these procedural outcomes is provided in the supplemental materials (Supplemental Tables 3 and 4, Supplemental Figure 1).
Plasma Protein Time Series Analysis
The concentrations of 21 plasma inflammatory proteins were measured and analyzed for changes during the initial 30 days following the procedure. Of the 21 plasma proteins analyzed, only IL-6 demonstrated time-dependent changes that exceeded the Bonferroni-adjusted cutoff of P < .0024. An initial increase in IL-6 was detectable by 2 hours and peaked at one day following the procedure (7.01 ± 4.73 vs. 15.96 ± 4.97 ng/ml, P = .001), returning to baseline by one week. Detail regarding the magnitude and pattern of time-dependent variations for four proteins of interest [interleukin 6 (IL-6), interleukin 8 (IL-8), monocyte chemoattractant protein-1 (MCP-1), and soluble CD-40 ligand (CD-40)] is provided in the supplemental materials (Supplemental Figure 2).
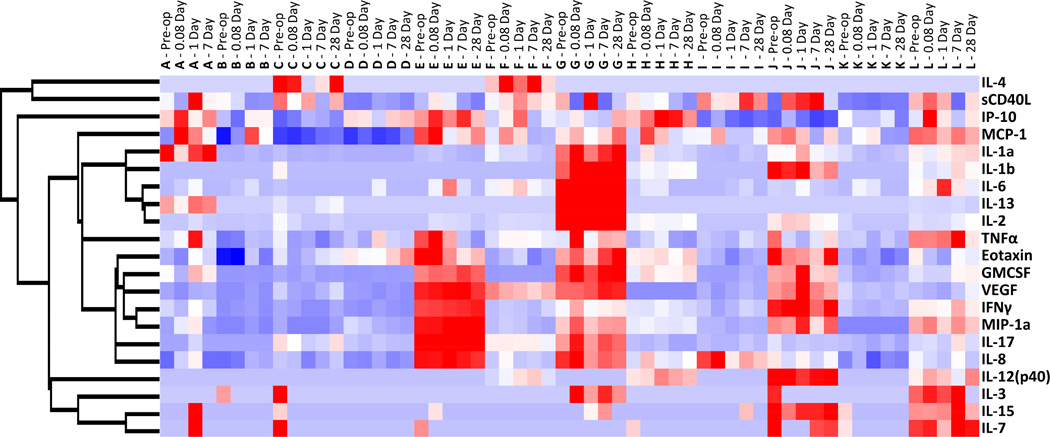
Global changes in circulating plasma proteins were examined using unsupervised hierarchical clustering, where each sample obtained from a patient at a specific time was assumed independent. Clustering along the patient/time axis demonstrated substantial patient-to-patient variability, with relatively modest changes within a single patient as a function of time. Of note, the horizontal dendrogram revealed eleven nodes of primary clustering, of which ten correspond to an individual patient. Each patient appeared to have a unique inflammatory protein profile that did not dramatically change in response to the intervention. Further insight into these patterns is provided by the supervised cluster analysis in Figure 1 with additional detail provided in the supplemental materials (Supplemental Figure 3).
Figure 1.
Supervised hierarchal clustering analysis of plasma inflammatory protein concentrations. Each patient sample at each time point is displayed across the x-axis, with each patient represented by the letters A through L. Each patient appears to have a unique inflammatory protein profile that remains relatively constant following endovascular intervention. Red represents up-regulation and blue represents down-regulation.
Monocyte Phenotypic and Genotypic Time Series Analyses
Temporal changes in monocyte subpopulations were investigated via flow cytometry using CD14 and CD16 surface expression markers (Figure 2A). Classical monocytes, identified through expression of CD14 only (CD14+/CD16−), compromised approximately 6% of the total leukocyte population, which was unchanged during the initial 28 days following intervention. The subpopulation of pro-inflammatory monocytes, identified through co-expression of CD14 and CD16, comprised 1% of the total leukocyte population and demonstrated no significant time-dependent variation following the procedure. Integrin surface expression, as determined by CD18, CD11a, and CD11b, were similar between the two monocyte subpopulations and independent of time, suggesting no marked influence on the intrinsic potential for monocyte adhesion or migration following the procedure (Figures 2B and 2C). Interestingly, the CD14+/CD16− and CD14+/CD16+ subpopulations demonstrated a consistent difference in HLA-DR expression across all time points (P = .021), suggesting the pro-inflammatory phenotype to have a reduced ability for antigen presentation.
Figure 2.
Circulating monocyte phenotypes following lower extremity endovascular revascularization. A, Classic monocytes, identified by expression of CD14 only (CD14+/CD16−), remained stable over time. Pro-inflammatory monocytes, identified by co-expression of CD14 and CD16, also remained stable over time, although the presence of this subtype appeared to demonstrate a downward trend following revascularization. B–C, Integrin surface expression (CD18, CD11a, and CD11b) was similar between the two monocyte phenotypes. CD14+/CD16− cells demonstrated a greater percentage of HLA DR+ cells across all time points compared to CD14+/CD16+ cells (p=.021).
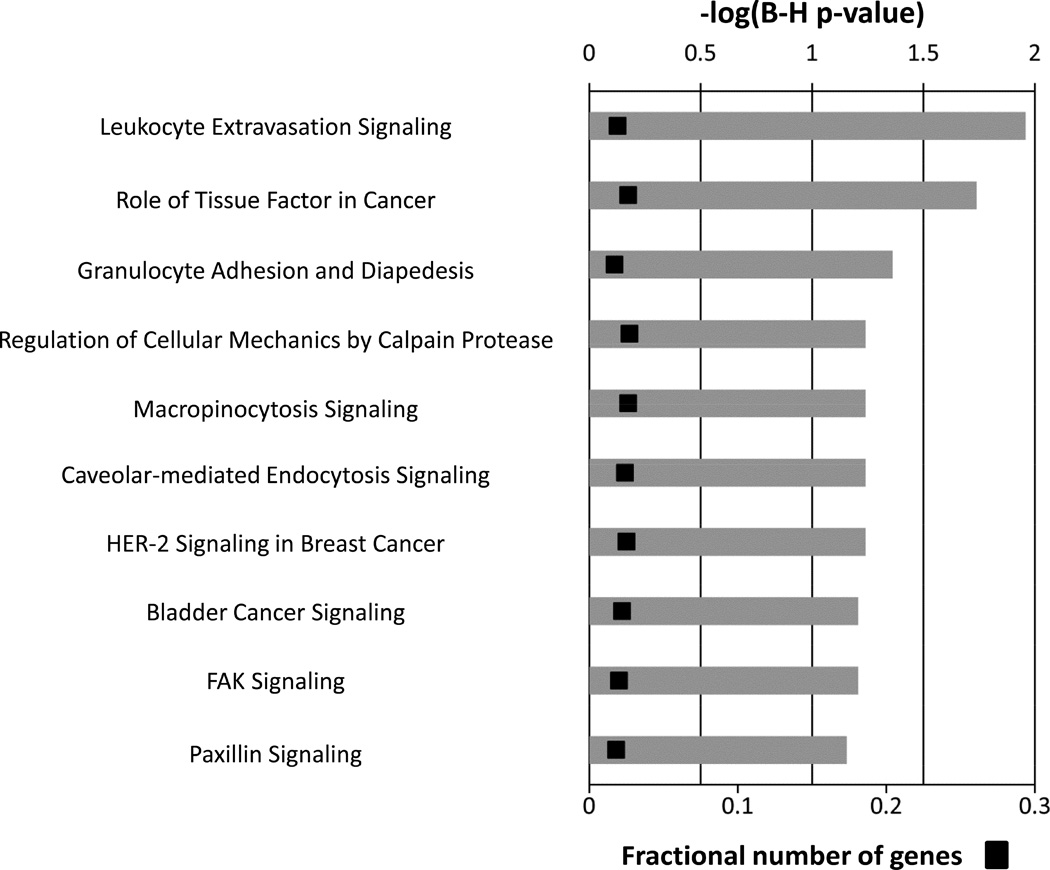
Since subtle changes in monocyte function may manifest outside of marked variations in monocyte phenotype, the temporal changes in the genomic expression profile of circulating monocytes were examined. A time series regression identified differences in 31 out of 20,533 annotated probe sets within the initial month following the intervention (FDR = .05) (Table 3). IPA analysis was used to delineate the dominant canonical pathways for these genes as a function of time (Figure 3). Leukocyte extravasation signaling was identified as the top pathway (FDR-corrected P = .011), suggesting revascularization for PAD alters monocyte adhesion and migration that is independent of integrin (CD18, CD11a, and CD11b) surface expression.
Table 3.
Time-Dependent Genes
| Accession Number | Name | Cluster |
|---|---|---|
| ENST00000364587 | small nucleolar RNA, H/ACA box 55 | A |
| NM_181791 | G protein-coupled receptor 141 | A |
| NM_177437 | taste receptor, type 2 | A |
| NM_182790 | nicotinamide phosphoribosyltransferase | A |
| ENST00000375951 | Tripartite motif-containing protein LOC642612 | A |
| NM_033180 | olfactory receptor, family 51, subfamily B, member 2 | A |
| ENST00000329076 | Q9P175_HUMAN (uncharacterized protein) | A |
| NM_177551 | G protein-coupled receptor 109A | A |
| NM_005024 | serpin peptidase inhibitor, clade B (ovalbumin) | A |
| NM_146421 | glutathione S-transferase M1 | B |
| NM_003005 | selectin P | B |
| NM_014600 | EH-domain containing 3 | B |
| NM_206943 | latent TGF-β binding protein 1 | B |
| NM_001963 | epidermal growth factor | B |
| NM_138277 | chromosome 6 open reading frame 25 | B |
| NM_024123 | lymphocyte antigen 6 complex | B |
| NM_178174 | triggering receptor expressed on myeloid cells-like 1 | B |
| ENST00000289473 | neutrophil cytosolic factor 1 | B |
| ENST00000297078 | hypothetical protein LOC340286 | B |
| NM_014020 | transmembrane protein 176B | B |
| NM_004493 | hydroxysteroid (17-beta) dehydrogenase 10 | B |
| NM_014000 | vinculin | B |
| NM_145651 | secretoglobin, family 1C | B |
| NM_002421 | matrix metallopeptidase 1 | B |
| ENST00000381767 | CDNA FLJ16817 | B |
| NM_022060 | abhydrolase domain containing 4 | B |
| NM_005533 | interferon-induced protein 35 | B |
| NM_000212 | integrin, beta 3 | B |
| ENST00000323589 | Q659F3_HUMAN (uncharacterized protein) | B |
| NM_178121 | Putative uncharacterized protein C19orf49 | B |
| NM_019855 | calcium binding protein 5 | B |
Figure 3.
Canonical pathways representing the 31 genes demonstrating a significant change in the initial one month following the intervention. Multiple-testing corrected p-values were employed to control the rate of false discoveries. The first three pathways are considered to be significantly enriched for this gene set (calculated using the Benjamini-Hochberg method, FDR-corrected p-value <.05). The black boxes represent the fraction of predictive genes in each pathway.
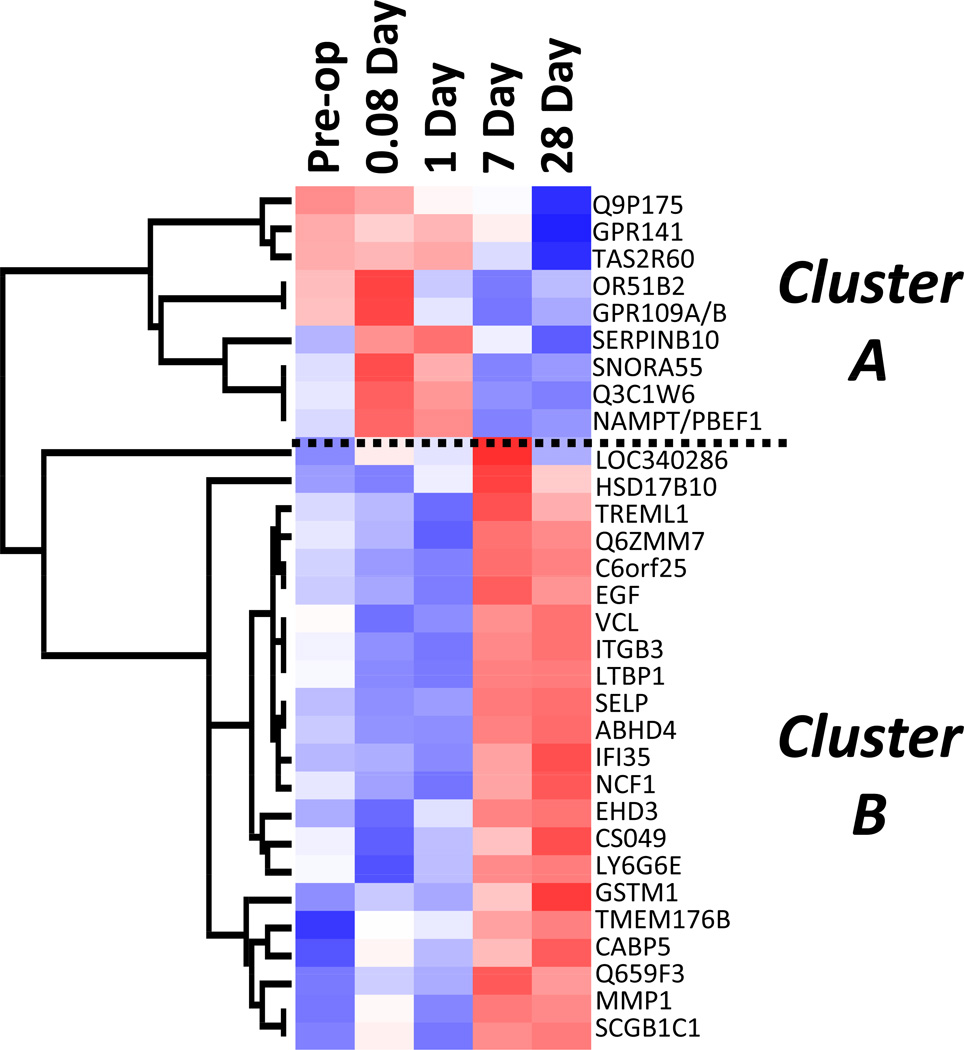
A supervised cluster analysis of this gene set demonstrated two distinct expression patterns (Figure 4). Nine probe sets (Cluster A) displayed an immediate, transient increase in expression, and 22 probes (Cluster B) exhibited an initial down-regulation followed by a delayed up-regulation at 7 to 28 days. While the genes in Cluster A showed no dominant functional associations, ontological analysis of Cluster B genes demonstrated 12 of 22 genes to be involved in either cellular movement or cardiovascular system development and function. Figure 5 illustrates the dynamics of this integrated pathway, as the components change over time.
Figure 4.
Supervised hierarchal clustering analysis of 31 genes demonstrating a significant change in expression following revascularization. Mean expression data at each time point are presented across the x-axis. The vertical dendrogram reveals two distinct gene clusters with differential expression. Cluster A consists of 9 genes that exhibit early up-regulation (pre-op, 0.08d, and 1d), while Cluster B consists of 22 genes that exhibit late up-regulation (7d and 28d).
Figure 5.
Ingenuity Pathway Analysis of 31 genes demonstrating a significant change in expression following revascularization. The network encompassing this gene set is presented at four time points following intervention. Red indicates up-regulation and blue indicates down-regulation (relative to preoperative expression levels).
Biologic Determinants of Revascularization Success or Failure
A comprehensive comparative analysis of fourteen index procedures was performed using the case-control study design described above. Relationships between circulating plasma protein concentrations and the one-year success or failure of endovascular intervention were investigated. Using a modified significance level to accommodate the multiple testing bias, mixed linear modeling identified no individual protein to be predictive of success or failure. To investigate the potential for developing a pre-procedure or early post-procedure classifier, individual proteins with p-values < .10 based on univariate analysis were considered candidates for inclusion in a multivariate model (IL-15, IL-3, IL-7, and IP-10 pre-procedure; Eotaxin, IP-10, and TNFα at Day 1; Table 4). In part restricted by the limited size of the data set, a robust, predictive model of intervention success or failure did not emerge.
Table 4.
Univariate analyses of plasma proteins between outcome groups
| Plasma Protein | Pre-op Sample (p-value) * |
Day 1 Sample (p-value) * |
|---|---|---|
| Eotaxin | 1.0 | 0.07 |
| GMCSF | 1.0 | 0.88 |
| IFNγ | 0.639 | 1.0 |
| IL-12 | 0.629 | 0.63 |
| IL-13 | 1.0 | 0.67 |
| IL-15 | 0.009 | 0.77 |
| IL-17 | 1.0 | 0.29 |
| IL-1a | 1.0 | 0.53 |
| IL-1b | 0.277 | 0.92 |
| IL-2 | 0.363 | 0.28 |
| IL-3 | 0.082 | 0.8 |
| IL-4 | 0.803 | 0.5 |
| IL-6 | 0.862 | 0.34 |
| IL-7 | 0.069 | 1.0 |
| IL-8 | 0.755 | 0.34 |
| IP-10 | 0.073 | 0.03 |
| MCP-1 | 0.53 | 0.64 |
| MIP-1a | 0.935 | 0.42 |
| sCD40L | 0.639 | 1.0 |
| TNFα | 0.371 | 0.07 |
| VEGF | 0.745 | 0.81 |
| hsCRP | 0.335 | 0.344 |
T-test comparison of success and failure groups
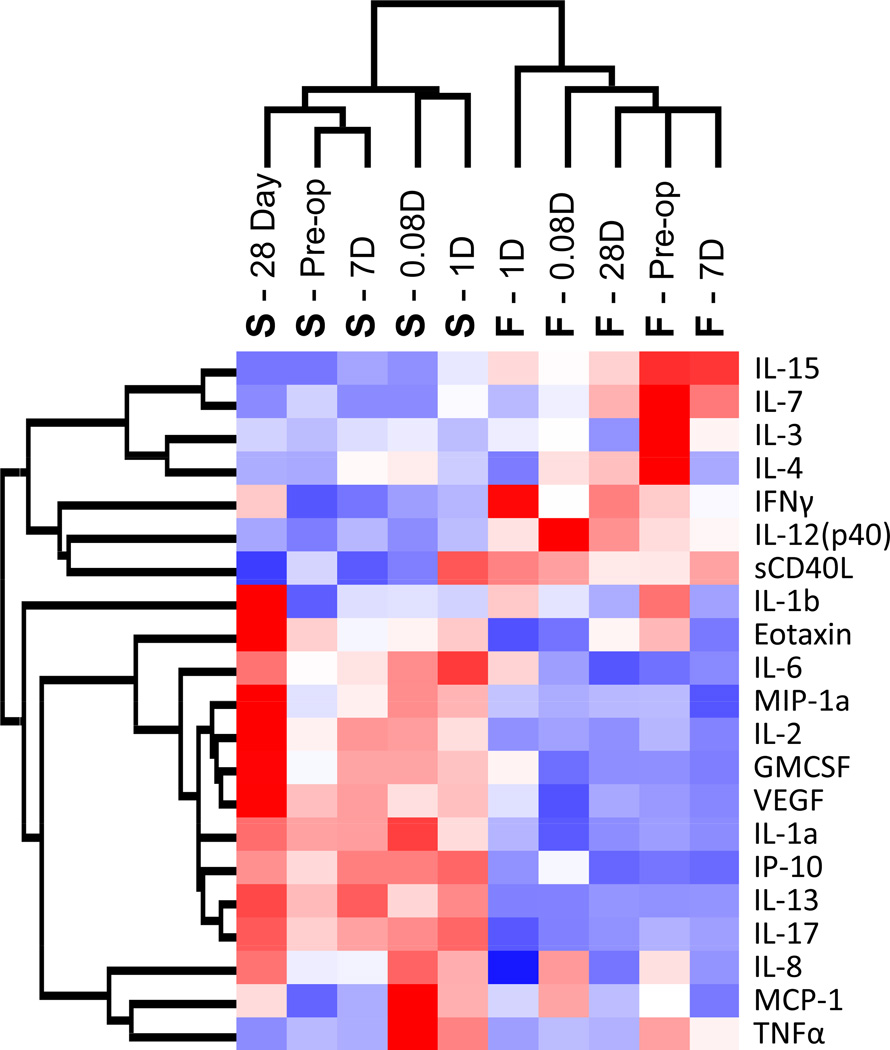
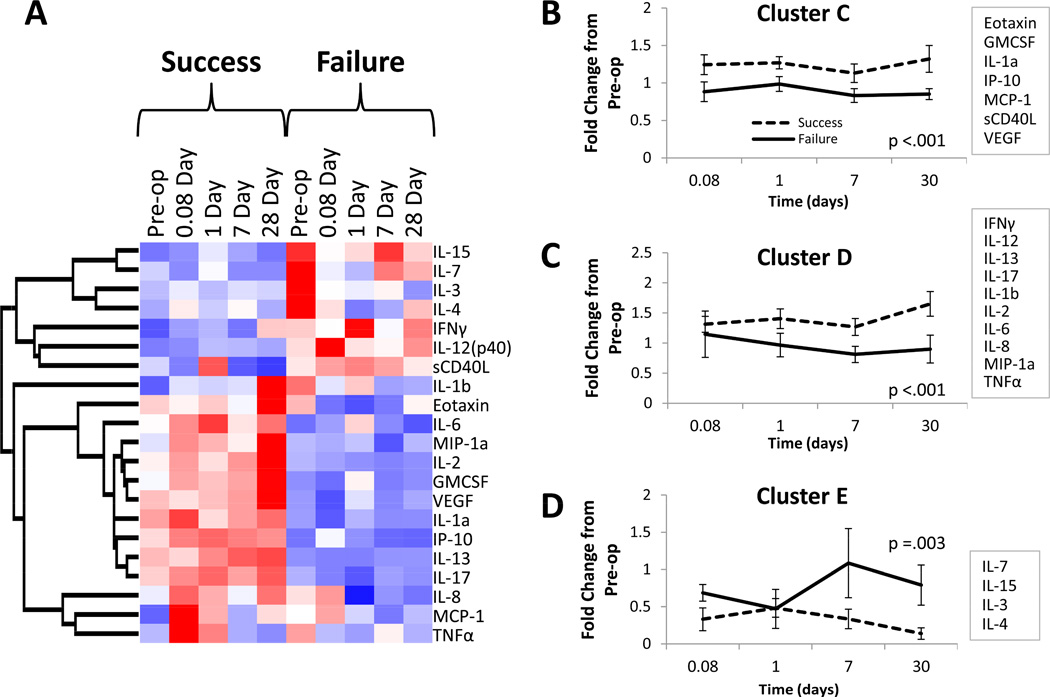
Investigation of the dynamic protein expression patterns using an unsupervised cluster analysis, incorporating both time and one-year patency, revealed a tight clustering of success and failure groups with a primary node of clustering providing distinct separation of these outcomes (Figure 6). The time at which samples were collected demonstrated no discernible pattern within each of these dominant clusters, suggesting the baseline activation state of the patient to be the dominant predictor of intervention success or failure. A supervised cluster analysis using blocked time sequences yields an identical arrangement of proteins (Figure 7). Further exploration of this data set using a dynamic clustering algorithm revealed three distinct patterns of protein expression (Figure 7, B–D), with all clusters demonstrating significant outcome-dependent differences. The number of proteins in each cluster ranged from 4 to 10, without a clear unifying ontology.
Figure 6.
Unsupervised hierarchal clustering analysis of plasma inflammatory protein concentrations. Mean plasma protein concentrations at each time point for both outcome groups are displayed across the x-axis. The horizontal dendrogram reveals a tight clustering of the two outcome groups, demonstrating two divergent patterns of protein expression. Red represents up-regulation and blue represents down-regulation.
Figure 7.
Clustering analysis of plasma inflammatory protein concentrations. A, Mean plasma protein concentrations at each time point for both outcome groups are displayed across the x-axis. The heat map reveals two divergent patterns of protein expression across all time points between the two outcome groups. B–D, A dynamic clustering algorithm identified three distinct patterns of protein expression. Mean fold change from baseline (preoperative) concentrations of all proteins within each cluster for each outcome group is displayed. All three clusters demonstrated highly significant outcome-dependent differences (ANOVA).
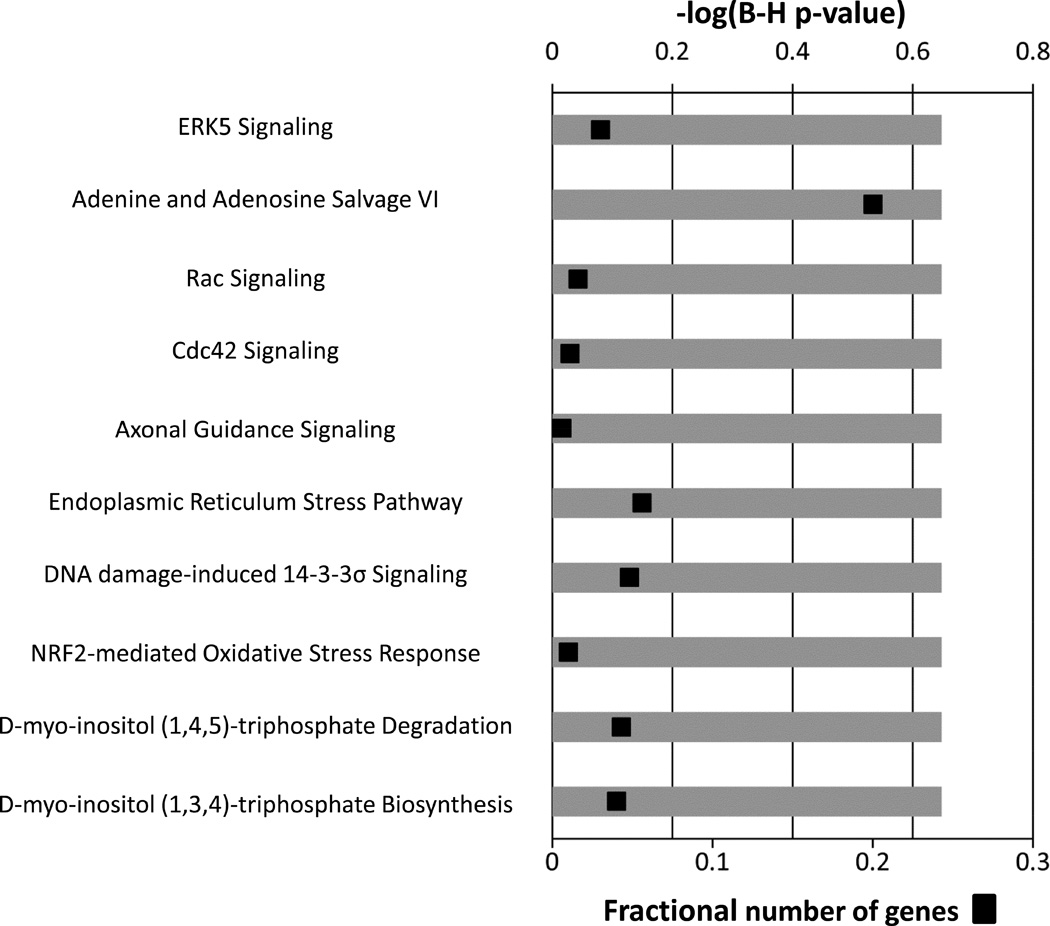
The relationship between monocyte gene expression and clinical outcomes was explored at each time point using a class prediction analysis. Thirty-nine annotated probe sets were sufficient to differentiate between the success and failure groups at 1 day (Table 5), with a class prediction rate of 77% and 69% by leave-one-out and leave-three-out cross validation, respectively (Supplemental Table 5). Pathway analysis identified extracellular signal regulated kinase 5 (ERK5) signaling to be the top canonical pathway associated with this gene set (Figure 8). Cross-validation analyses at the remaining time points (pre-op, 2 hours, 7 days, and 28 days) demonstrated moderate correlations with limited predictive value, suggesting the initial monocyte response to be dominant for defining the clinical outcome of the intervention.
Table 5.
Outcome-predictive genes at 1-day after revascularization
| Accession Number | Name | Parametric p-value |
Cluster |
|---|---|---|---|
| NM_178026 | gamma-glutamyltransferase 7 | 6.67E-05 | A |
| NM_002379 | matrilin 1, cartilage matrix protein | 0.0001012 | A |
| ENST00000356052 | Beclin-1-like protein 1 | 0.000151 | A |
| NM_004584 | RAD9 homolog A (S. pombe) | 0.0001662 | A |
| NM_001039768 | lung carcinoma-associated protein | 0.0002263 | A |
| NM_172225 | diencephalon/mesencephalon homeobox 1 | 0.0002718 | A |
| NM_019892 | inositol polyphosphate-5-phosphatase, 72 kDa | 0.0002931 | A |
| NM_003813 | ADAM metallopeptidase domain 21 | 0.0003416 | A |
| NM_002248 | potassium intermediate/small conductance Ca-activated channel | 0.000371 | A |
| NM_144617 | heat shock protein, alpha-crystallin-related, B6 | 0.0003724 | A |
| NM_058238 | wingless-type MMTV integration site family, member 7B | 0.0004021 | A |
| NM_023931 | zinc finger protein 747 | 0.0004716 | A |
| ENST00000380145 | CDNA FLJ46121 fis, | 0.0004936 | A |
| NM_001039617 | zinc finger, DHHC-type containing 19 | 0.0005053 | A |
| NM_002347 | lymphocyte antigen 6 complex, locus H | 0.0005347 | A |
| NM_138284 | interleukin 17D | 0.0006046 | A |
| NM_015589 | sterile alpha motif domain containing 4A | 0.0006212 | A |
| NM_145807 | hypothetical protein BC018697 | 0.0007131 | A |
| NM_022046 | kallikrein-related peptidase 14 | 0.0007137 | A |
| NM_172168 | NADPH oxidase organizer 1 | 0.0007185 | A |
| NM_001024598 | hairy and enhancer of split 3 | 0.0007515 | A |
| ENST00000374157 | family with sequence similarity 170, member B | 0.0007851 | A |
| NM_025084_dup1 | Q6P168_HUMAN | 0.0008005 | A |
| NM_005438 | FOS-like antigen 1 | 0.0008153 | A |
| NM_005514 | major histocompatibility complex, class I, C | 0.0008344 | A |
| NM_006105 | Rap guanine nucleotide exchange factor (GEF) 3 | 0.0008728 | A |
| ENST00000379421 | diacylglycerol O-acyltransferase 2 like protein 7 | 0.0009385 | A |
| NM_021795 | ELK4, ETS-domain protein (SRF accessory protein 1) | 0.0009768 | B |
| NM_001039083 | ADP-ribosylation factor-like protein 17 | 0.0009651 | B |
| NM_019054 | family with sequence similarity 35, member A /// Protein FAM35A. | 0.0009036 | B |
| NM_004836 | eukaryotic translation initiation factor 2-alpha kinase 3 | 0.0009033 | B |
| NM_006721 | adenosine kinase | 0.000862 | B |
| ENST00000328474 | Q9P192_HUMAN | 0.0006103 | B |
| NM_001013743 | PMP22 claudin domain-containing protein | 0.000505 | B |
| NM_001031617 | COX19 cytochrome c oxidase assembly homolog | 0.0004825 | B |
| NM_182802 | minichromosome maintenance complex component 8 | 0.0004704 | B |
| NM_133473 | zinc finger protein 431 | 0.0004461 | B |
| NM_138638 | cofilin 2 (muscle) | 0.0003867 | B |
| ENST00000354259 | zinc finger protein 568 | 0.0003251 | B |
Figure 8.
Canonical pathways associated with the subset of day-one genes that differentiate long-term success or failure of the intervention. The ten most significant canonical pathways representing these 39 genes are presented. Multiple-testing corrected p-values were employed to control the rate of false discoveries. The black boxes represent the fraction of predictive genes in each pathway.
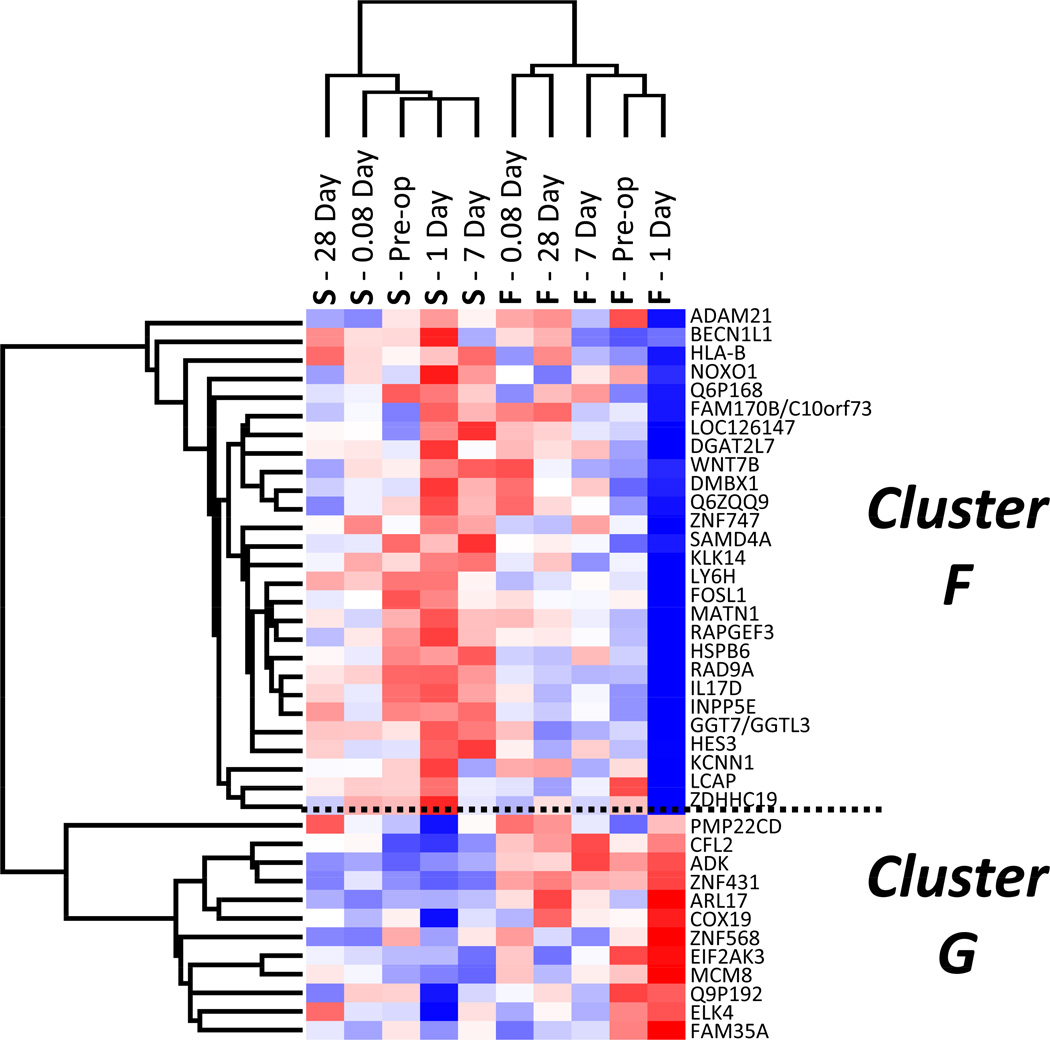
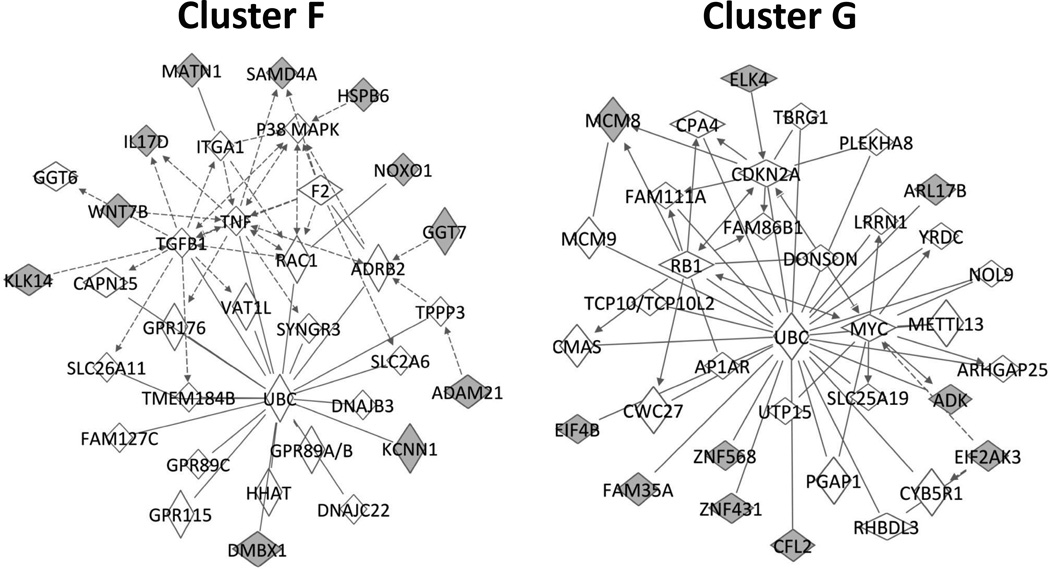
Focusing on the predictive Day 1 genes, clustering analysis was used to define two dominant clusters (identified as Clusters F and G) with differential expression patterns that were highly correlated with clinical outcomes (Figure 9). A more in-depth analysis revealed 11 of 25 genes in Cluster F and 10 of 12 genes in Cluster G to be contained in two unique cell cycle networks (Figure 10), suggesting that differential regulation of these cell cycle pathways in the circulating monocyte may be an important event in defining success or failure following intervention.
Figure 9.
Unsupervised hierarchal clustering analysis of the subset of 39 day-one genes that differentiate long-term success or failure. Mean expression data for both outcome groups at each time point is presented across the x-axis. Although this gene subset was selected for its ability to predictive outcome at one day following revascularization, the primary node of clustering separates the outcome groups across all time-points. Red represents up-regulation and blue represents down-regulation.
Figure 10.
Ingenuity Pathway Analysis of the subset of day-one genes that differentiate long-term success or failure, divided into two groups (F and G) following an unsupervised cluster analysis. The network pathway on the left contains 11 of the 25 cluster F genes, and is primarily involved in cell death and survival. The pathway on the right contains 10 of the 12 cluster G genes, and is primarily associated with cell cycle regulation. Class prediction genes are represented in gray.
No analysis was performed to attempt to merge the cytokine concentration data with the gene expression data in relation to clinical outcome. Based on the study protocol, how the samples were processed and the resulting source material analyzed, the leukocyte gene expression would not be expected to correlate with the plasma cytokine concentrations. The source of most plasma cytokines is from fixed tissue macrophages, primarily in the splanchnic bed and not from circulating blood leukocytes.23
Discussion
While injury associated with trauma or major open vascular procedures24 is significant, the impact from minimally invasive procedures such as arterial angioplasty or stent placement, on systemic inflammation remains poorly defined. Previous investigation focusing on peripheral intervention is limited to a single study which identified changes in several pro-inflammatory cytokines within 24 hours following percutaneous angioplasty.25 In our current observational study, the results suggest that peripheral intervention may have only a minor influence on the inflammatory state of the patient, with the inherent patient-to-patient variation exceeding the biologic impact of the procedure. However, notable was the identification of key differences present prior to or early post-intervention, suggesting that patients are primed for success or failure. This provides the potential to identify at-risk patients during initial clinical decision5 making. Our proteomic data suggests that circulating levels of IL-15, IL-3, IL-7, IP-10 pre-procedure, and Eotaxin, IP-10, and TNFα at Day 1 post-procedure have emerged as promising candidates that should be the focus of further investigation. Genomic analyses in the early post-intervention time frame identified 39 genes that discriminated between clinical success and failure. Specific components, such as the genes associated with leukocyte extravasation and cell cycle activity, were notably influenced by the procedure, and serve as potential opportunities for therapeutic intervention.
Specifically, among these genes, the ERK5 pathway was identified as the top canonical pathway. Activated by growth factors and oxidative stress, ERK5 has important roles in both cellular proliferation and differentiation and is a key regulator in TLR2 signaling.26 This pathway has been implicated in both angiogenesis and vascular development,27 but its role in monocyte biology has not yet been explored. Also of interest, differentially regulated genes in success patients demonstrated nodes of clustering around ubiquitin C, a major pathway of non18 lysosomal degradation of intracellular proteins28 and pivotal to many cellular processes including cell proliferation and cell cycle progression. Recent experimental evidence supports the involvement of the ubiquitin–proteasome system in inflammation and cardiovascular disease,29 with activation of this system by inflammatory cells leading to an NF-κB–dependent increase in inflammation.
While direct comparison to our current study is difficult, the CardioGene study aimed to identify systemic determinants of coronary in-stent restenosis using similar high-throughput technologies.30 Examining gene expression of circulating monocytes following coronary stenting, the investigators identified 32 genes with differential expression in patients that developed in-stent restenosis within one year of the procedure.31 Ontology analysis revealed five of these genes to have functions related to cell death and survival. Although the specific genes identified differed, both the number of predictive genes and the ontology were similar to the findings of our current study suggesting that identification and validation of a manageable number of biologically relevant genes is feasible. As more data from studies employing this type of molecular strategy for class prediction across cardiovascular domains become available, we hope to see unifying patterns emerge that will enable a personalized medicine approach to peripheral intervention and improved outcomes.
Based on the new knowledge gained from these pilot data, we strongly feel that defining inflammatory “signatures” comprised of panel(s) of inflammatory genes and/or cytokines holds more promise in developing tools to accurately and consistently predict patient outcomes. The literature has focused more on attempts to identify a single biomarker with predictive value, with much of this focused on C-reactive protein (CRP). In coronary intervention, pre-procedural CRP levels can predict periprocedural adverse events such as myocardial infarction (MI) or congestive heart failure (CHF), but have less correlation with specific intervention success or failure (i.e. restenosis).31 Similar findings have been reported in peripheral intervention as well, with CRP predictive or perioperative MI and CHF, but less well correlated with stent or vein bypass success or failure.32 One recent study found the combination of elevated pre-operative CRP along with brain natriuretic peptide (BNP) as strongly predictive again of perioperative systemic cardiovascular events, but did also suggest an association between pre-operative CRP and failure of femoropopliteal interventions.33 None looked at trends in CRP over time before and after intervention. In our hands, CRP hasn’t, either alone or in combination with other cytokines, been a strong predictor of peripheral angioplasty/stent outcomes. We feel this further validates the promise of the genome-wide, high-throughput strategy outlined in our current study over targeting a single biomarker.
The primary limitation of this study centers on the small sample size and the potential for Type II error. Because this was intended as an exploratory pilot study, we chose a matched case-control strategy to best leverage the quality of the data. Although we trust the algorithm used to match patients with failed interventions to patients from the larger pool of successful outcomes, the influence of selection bias from this limited patient pool is unavoidable. With this matched group we also attempted to minimize the influence of heterogeneity of the cohort with respect to disease severity and the specific nuances of their intervention. Within the analysis itself, we identified two sets of genes that were significantly correlated with changes in time and outcome, respectively. While our statistical strategy minimized false-positives given the small number of proteins/genes discovered, and partially validated the model, gold-standard validation will require continued enrollment and application of these methods to a larger independent cohort of patients.
Conclusion
We have shown that endovascular revascularization has a modest influence on the activation state of the systemic inflammatory system, as defined by plasma inflammatory proteins and monocyte phenotype and inflammatory gene expression. This might be expected given its minimally invasive nature compared to open surgical revascularization. However, examination of the monocyte genome also identified time-dependent changes in the initial 28 days following the procedure, predominately in those genes associated with leukocyte extravasation and cell migration, and a subset of genes active in cell cycle signaling at one-day post-procedure that were predictive of clinical outcome. In addition, although no single plasma protein was correlated with the outcome, cluster analysis revealed a clear pattern of protein expression that was closely related to the clinical phenotype. These findings support this approach to studying the critical relationship between systemic inflammation and one-year clinical success or failure rates following percutaneous intervention.
Supplementary Material
Clinical Relevance Statement.
Endovascular intervention for lower extremity peripheral arterial disease is increasing exponentially, but short-term patency rates remain in the 50–60% range. This study uses a high-throughput molecular strategy to define pre-procedural and early post-procedural alterations inflammatory signatures for patients at risk for early intervention failure. A number of promising proteomic markers and gene expression clusters were identified, specifically implicating pathways involving leukocyte extravasation, cellular migration, and cell-cycle signaling. This new knowledge enables personalized medicine by using this information in critical decision-making prior to intervention, or by intervening early post-procedure to re-engineer a patient’s course to a favorable outcome.
Acknowledgements
The authors wish to thank Michael Hong, MD and Christian Restrepo for their early contributions to this project and Dan Neal, Rongling Wu, and Yaqun Wang for contributing their statistical expertise to this manuscript. This work was supported in part by NHLBI grant 1K23HL084090-01 (PRN), VA CSR&D Merit Review grant (SAB) and T32GM008721-15 (LLM).
Footnotes
Publisher's Disclaimer: This is a PDF file of an unedited manuscript that has been accepted for publication. As a service to our customers we are providing this early version of the manuscript. The manuscript will undergo copyediting, typesetting, and review of the resulting proof before it is published in its final citable form. Please note that during the production process errors may be discovered which could affect the content, and all legal disclaimers that apply to the journal pertain.
References
- 1.Fowkes FGR, Rudan D, Rudan I, Aboyans V, Denenberg JO, McDermott MM, et al. Comparison of global estimates of prevalence and risk factors for peripheral artery disease in 2000 and 2010: a systematic review and analysis. Lancet. 2013;382(9901):1329–1340. doi: 10.1016/S0140-6736(13)61249-0. [DOI] [PubMed] [Google Scholar]
- 2.Goodney PP, Beck AW, Nagle J, Welch HG, Zwolak RM. National trends in lower extremity bypass surgery, endovascular interventions, and major amputations. J Vasc Surg. 2009;50(1):54–60. doi: 10.1016/j.jvs.2009.01.035. [DOI] [PubMed] [Google Scholar]
- 3.Hong MS, Beck AW, Nelson PR. Emerging national trends in the management and outcomes of lower extremity peripheral arterial disease. Ann Vasc Surg. 2011;25(1):44–54. doi: 10.1016/j.avsg.2010.08.006. [DOI] [PubMed] [Google Scholar]
- 4.Goel SA, Guo LW, Liu B, Kent KC. Mechanisms of post-intervention arterial remodelling. Cardiovasc Res. 2012;96(3):363–371. doi: 10.1093/cvr/cvs276. [DOI] [PMC free article] [PubMed] [Google Scholar]
- 5.Richter Y, Groothuis A, Seifert P, Edelman ER. Dynamic flow alterations dictate leukocyte adhesion and response to endovascular interventions. J Clin Invest. 2004;113(11):1607–1614. doi: 10.1172/JCI21007. [DOI] [PMC free article] [PubMed] [Google Scholar]
- 6.Kagan SA, Myers SI. Mediators of restenosis. Surg Clin North Am. 1998;78(3):481–500. doi: 10.1016/s0039-6109(05)70327-3. [DOI] [PubMed] [Google Scholar]
- 7.Zhang L-N, Parkinson JF, Haskell C, Wang Y-X. Mechanisms of intimal hyperplasia learned from a murine carotid artery ligation model. Curr Vasc Pharmacol. 2008;6(1):37–43. doi: 10.2174/157016108783331321. [DOI] [PubMed] [Google Scholar]
- 8.Becher RD, Hoth JJ, Miller PR, Meredith JW, Chang MC. Systemic inflammation worsens outcomes in emergency surgical patients. J Trauma Acute Care Surg. 2012;72(5):1140–1149. doi: 10.1097/TA.0b013e3182516a97. [DOI] [PubMed] [Google Scholar]
- 9.Finfer S. The Surviving Sepsis Campaign: robust evaluation and high-quality primary research is still needed. Intensive Care Med. 2010;36(2):187–189. doi: 10.1007/s00134-009-1737-4. [DOI] [PubMed] [Google Scholar]
- 10.Cobb JP, Mindrinos MN, Miller-Graziano C, Calvano SE, Baker HV, Xiao W, et al. Application of genome-wide expression analysis to human health and disease. Proc Natl Acad Sci USA. 2005;102(13):4801–4806. doi: 10.1073/pnas.0409768102. [DOI] [PMC free article] [PubMed] [Google Scholar]
- 11.Cuenca AG, Gentile LF, Lopez MC, Ungaro R, Liu H, Xiao W, et al. Development of a genomic metric that can be rapidly used to predict clinical outcome in severely injured trauma patients. Crit Care Med. 2013;41(5):1175–1185. doi: 10.1097/CCM.0b013e318277131c. [DOI] [PMC free article] [PubMed] [Google Scholar]
- 12.Nelson PR, O'Malley KA, Feezor RJ, Moldawer LL, Seeger JM. Genomic and proteomic determinants of lower extremity revascularization failure: rationale and study design. J Vasc Surg. 2007;45(Suppl A):A82–A91. doi: 10.1016/j.jvs.2007.03.01. [DOI] [PMC free article] [PubMed] [Google Scholar]
- 13.Norgren L, Hiatt WR, Dormandy JA, Nehler MR, Harris KA, Fowkes FGR. Inter-Society Consensus for the Management of Peripheral Arterial Disease (TASC II) J Vasc Surg. 2007;45(1):S5–S67. doi: 10.1016/j.jvs.2006.12.037. [DOI] [PubMed] [Google Scholar]
- 14.Rosenbaum PR. A characterization of optimal designs for observational studies. J Roy Stat Soc B Met. 1991;53:597–610. [Google Scholar]
- 15.Wang Y, Xu M, Wang Z, Tao M, Zhu J, Wang L, et al. How to cluster gene expression dynamics in response to environmental signals. Brief Bioinformatics. 2012;13(2):162–174. doi: 10.1093/bib/bbr032. [DOI] [PMC free article] [PubMed] [Google Scholar]
- 16.Eisen MB, Spellman PT, Brown PO, Botstein D. Cluster analysis and display of genome-wide expression patterns. PNAS. 1998;95:14863–14868. doi: 10.1073/pnas.95.25.14863. [DOI] [PMC free article] [PubMed] [Google Scholar]
- 17.Golub TR, Slonim DK, Tamayo P, Huard C, Gaasenbeek M, Mesirov JP, et al. Molecular classification of cancer: class discovery and class prediction by gene expression monitoring. Science. 1999;286(5439):531–537. doi: 10.1126/science.286.5439.531. [DOI] [PubMed] [Google Scholar]
- 18.Xu W, Seoka J, Mindrinos MN, Schweitzerb AC, Jiang H, Wilhelmy J, et al. Human transcriptome array for high-throughput clinical studies. PNAS. 2011;108(9):3707–3712. doi: 10.1073/pnas.1019753108. [DOI] [PMC free article] [PubMed] [Google Scholar]
- 19.Simon R, Lam A, Li M-C, Ngan M, Menenzes S, Zhao Y. Analysis of gene expression data using BRB-ArrayTools. Cancer Inform. 2007;3:11–17. [PMC free article] [PubMed] [Google Scholar]
- 20.Dudoit S, Fridlyand J, Speed TP. Comparison of Discrimination Methods for the Classification of Tumors Using Gene Expression Data. J Am Stat Assoc. 2002;97(457):77–87. [Google Scholar]
- 21.Radmacher MD, McShane LM, Simon R. A paradigm for class prediction using gene expression profiles. J Comput Biol. 2002;9(3):505–511. doi: 10.1089/106652702760138592. [DOI] [PubMed] [Google Scholar]
- 22.Benjamini Y, Drai D, Elmer G, Kafkafi N, Golani I. Controlling the false discovery rate in behavior genetics research. Behav Brain Res. 2001;125(1–2):279–284. doi: 10.1016/s0166-4328(01)00297-2. [DOI] [PubMed] [Google Scholar]
- 23.Fong YM, Marano MA, Moldawer LL, Wei H, Calvano SE, Kenney JS, et al. The acute splanchnic and peripheral tissue metabolic response to endotoxin in humans. J Clin Invest. 1990 Jun;85(6):1896–1904. doi: 10.1172/JCI114651. [DOI] [PMC free article] [PubMed] [Google Scholar]
- 24.Feezor RJ, Baker HV, Xiao W, Lee WA, Huber TS, Mindrinos M, et al. Genomic and proteomic determinants of outcome in patients undergoing thoracoabdominal aortic aneurysm repair. J Immunol. 2004;172(11):7103–7109. doi: 10.4049/jimmunol.172.11.7103. [DOI] [PubMed] [Google Scholar]
- 25.Parmar JH, Aslam M, Standfield NJ. Percutaneous Transluminal Angioplasty of Lower Limb Arteries Causes a Systemic Inflammatory Response. Ann Vasc Surg. 2009;23(5):569–576. doi: 10.1016/j.avsg.2009.02.004. [DOI] [PubMed] [Google Scholar]
- 26.Wilhelmsen K, Mesa KR, Lucero J, Xu F, Hellman J. ERK5 Protein Promotes, whereas MEK1 Protein Differentially Regulates, the Toll-like Receptor 2 Protein-dependent Activation of Human Endothelial Cells and Monocytes. J Biol Chem. 2012;287(32):26478–26494. doi: 10.1074/jbc.M112.359489. [DOI] [PMC free article] [PubMed] [Google Scholar]
- 27.Regan CP, Li W, Boucher DM, Spatz S, Su MS, Kuida K. Erk5 null mice display multiple extraembryonic vascular and embryonic cardiovascular defects. Proc Natl Acad Sci USA. 2002;99(14):9248–9253. doi: 10.1073/pnas.142293999. [DOI] [PMC free article] [PubMed] [Google Scholar]
- 28.Hershko A. Ubiquitin-mediated protein degradation. J Biol Chem. 1988;263(30):15237–15240. [PubMed] [Google Scholar]
- 29.Herrmann J, Ciechanover A, Lerman LO, Lerman A. The ubiquitin-proteasome system in cardiovascular diseases-a hypothesis extended. Cardiovasc Res. 2004;61(1):11–21. doi: 10.1016/j.cardiores.2003.09.033. [DOI] [PubMed] [Google Scholar]; Ganesh SK, Skelding KA, Mehta L, O'Neill K, Joo J, Zheng G, et al. Rationale and study design of the CardioGene Study: genomics of in-stent restenosis. Pharmacogenomics. 2004;5(7):952–1004. doi: 10.1517/14622416.5.7.949. [DOI] [PubMed] [Google Scholar]
- 30.Ganesh SK, Joo J, Skelding K, Mehta L, Zheng G, O'Neill K, et al. Time course analysis of gene expression identifies multiple genes with differential expression inpatients with in-stent restenosis. BMC Medical Genomics. 2011;4(1):20. doi: 10.1186/1755-8794-4-20. [DOI] [PMC free article] [PubMed] [Google Scholar]
- 31.Buffon A, Liuzzo G, Biasucci LM, Pasqualetti P, Ramazzotti V, Rebuzzi AG, et al. Preprocedural serum levels of C-reactive protein predict early complications and late restenosis after coronary angioplasty. JAC. 1999;34(5):1512–1521. doi: 10.1016/s0735-1097(99)00348-4. [DOI] [PubMed] [Google Scholar]
- 32.Owens CD, Ridker PM, Belkin M, Hamdan AD, Pomposelli F, Logerfo F, et al. Elevated C-reactive protein levels are associated with postoperative events in patients undergoing lower extremity vein bypass surgery. J Vasc Surg. 2007;45:2–9. doi: 10.1016/j.jvs.2006.08.048. [DOI] [PMC free article] [PubMed] [Google Scholar]
- 33.Stone PA, Schlarb H, Campbell JE, Williams D, Thompson SN, John M, et al. C-reactive protein and brain natriuretic peptide as predictors of adverse events after lower extremity endovascular revascularization. J Vasc Surg. 2014;60(3):652–660. doi: 10.1016/j.jvs.2014.03.254. [DOI] [PMC free article] [PubMed] [Google Scholar]
Associated Data
This section collects any data citations, data availability statements, or supplementary materials included in this article.


