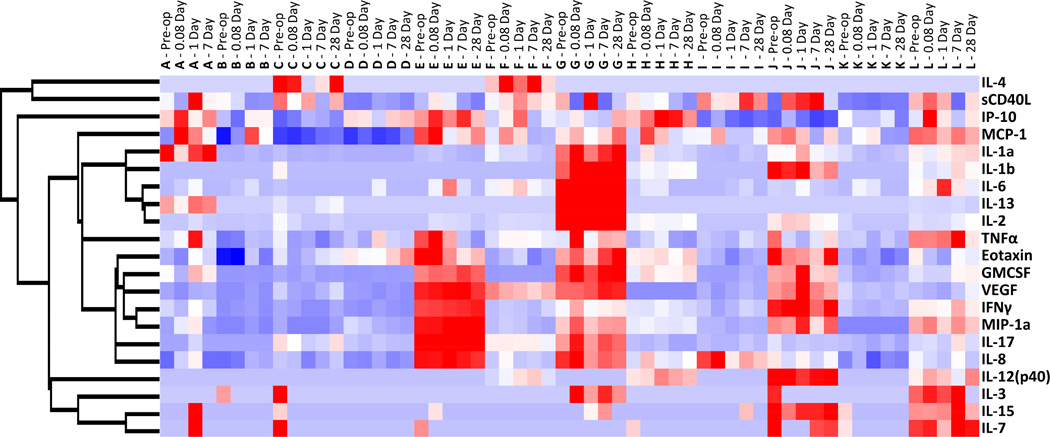
Figure 1.
Supervised hierarchal clustering analysis of plasma inflammatory protein concentrations. Each patient sample at each time point is displayed across the x-axis, with each patient represented by the letters A through L. Each patient appears to have a unique inflammatory protein profile that remains relatively constant following endovascular intervention. Red represents up-regulation and blue represents down-regulation.

