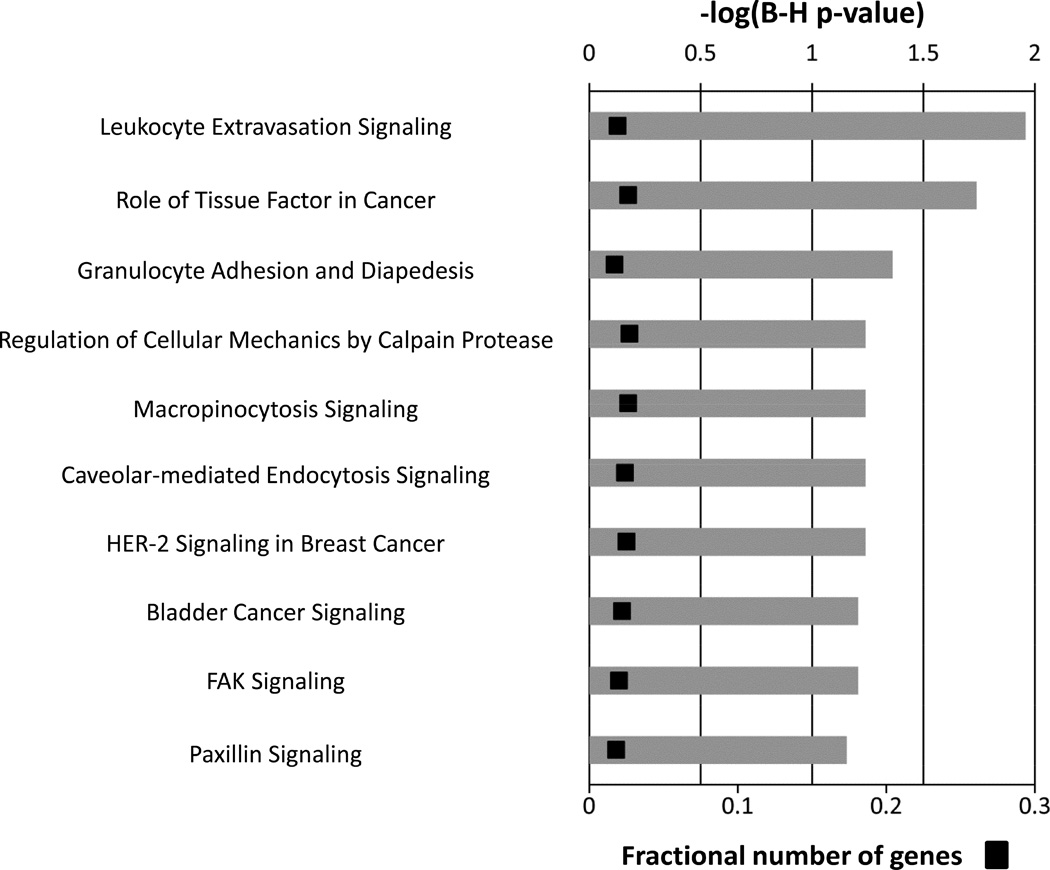
Figure 3.
Canonical pathways representing the 31 genes demonstrating a significant change in the initial one month following the intervention. Multiple-testing corrected p-values were employed to control the rate of false discoveries. The first three pathways are considered to be significantly enriched for this gene set (calculated using the Benjamini-Hochberg method, FDR-corrected p-value <.05). The black boxes represent the fraction of predictive genes in each pathway.

