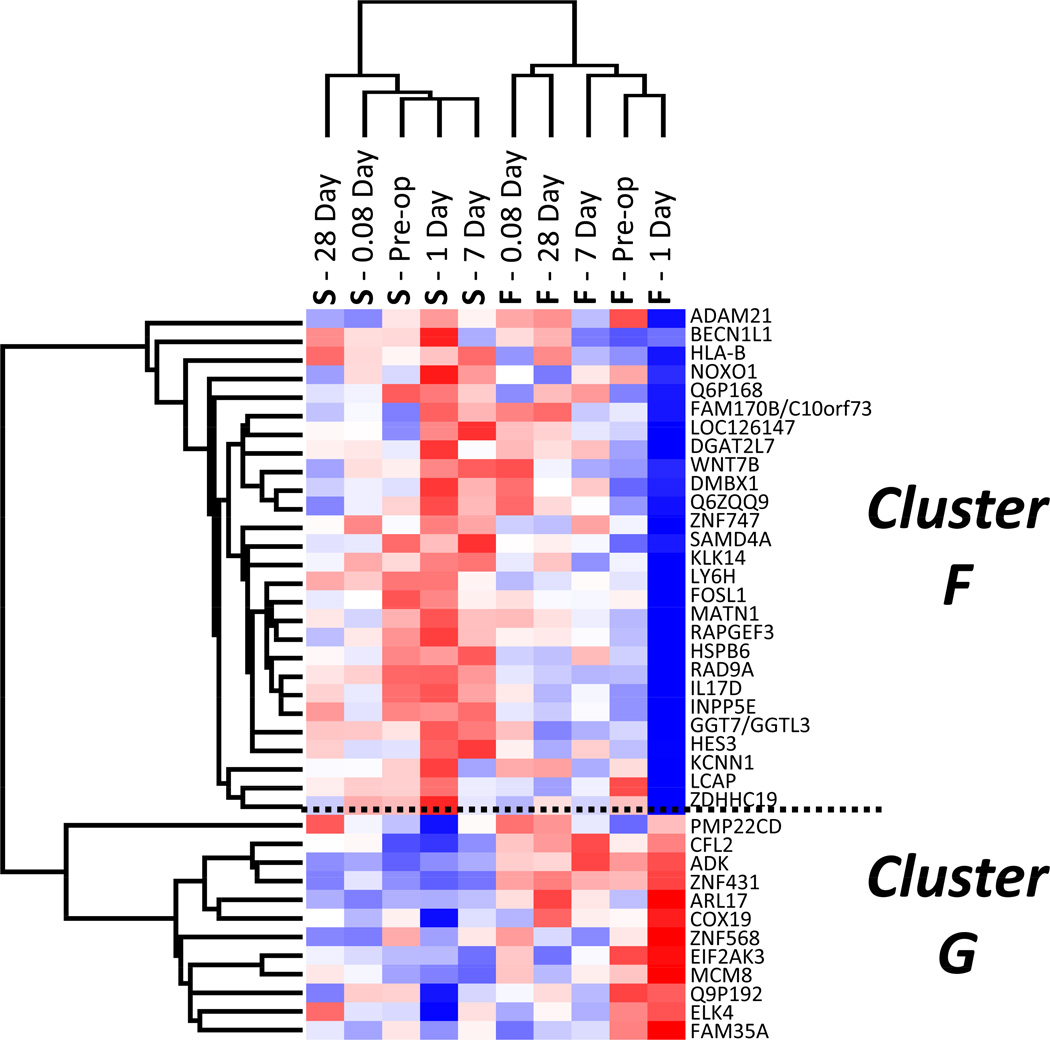
Figure 9.
Unsupervised hierarchal clustering analysis of the subset of 39 day-one genes that differentiate long-term success or failure. Mean expression data for both outcome groups at each time point is presented across the x-axis. Although this gene subset was selected for its ability to predictive outcome at one day following revascularization, the primary node of clustering separates the outcome groups across all time-points. Red represents up-regulation and blue represents down-regulation.

